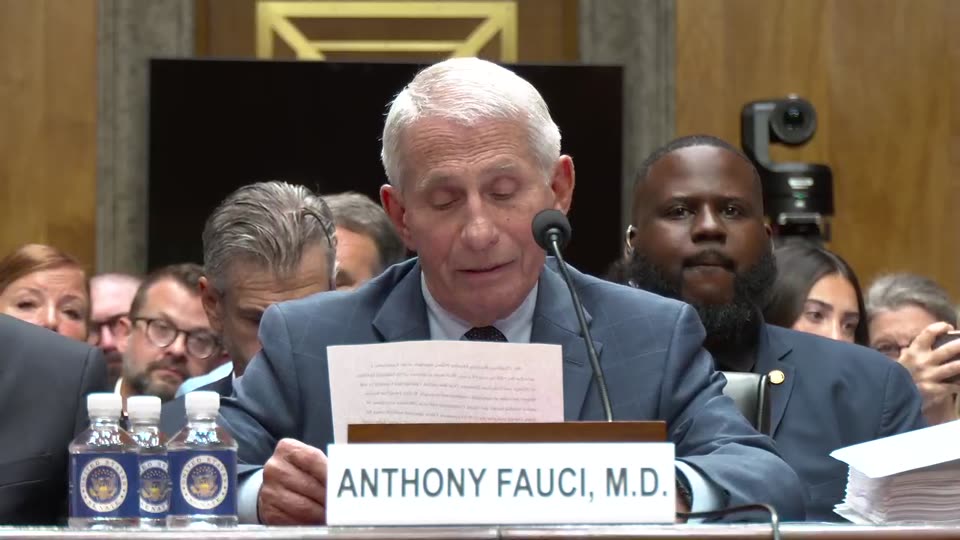
Dr Anthony Fauci invoking the Fifth Amendment, Senate Homeland Security Committee, 29 July 2026. Footage: official US Senate committee video (US government work). Silent loop 0:40:28-0:40:34; sound clip 0:40:13-0:40:36 with the Senate’s caption wording. sourceWatch on the official Senate player at 40:22
Would you buy a used car from this man? Then why trust him with your baby?
Why did this man get a presidential pardon? What for?
What it covers. Signed 19 Jan 2025: “A FULL AND UNCONDITIONAL PARDON FOR ANY OFFENSES against the United States which he may have committed or taken part in during the period from January 1, 2014, through the date of this pardon arising from or in any manner related to his service as Director of the National Institute of Allergy and Infectious Diseases, as a member of the White House Coronavirus Task Force or the White House COVID-19 Response Team, or as Chief Medical Advisor to the President.” source
What offence? None is named. It was granted before any charge, and DOJ lists his sentence as “N/A”. It does not cover state charges or anything after 19 Jan 2025. sourcesource
Biden’s stated reason (20 Jan 2025): “These public servants have served our Nation with honor and distinction and do not deserve to be the targets of unjustified and politically motivated prosecutions.” Also: “The issuance of these pardons should not be mistaken as an acknowledgment that any individual engaged in any wrongdoing, nor should acceptance be misconstrued as an admission of guilt for any offense.” source
Challenges, as of 22 Oct 2026. In Oct 2025 House Oversight Republicans said the committee “deems void President Biden’s executive actions that were signed using the Autopen”. Biden had said: “I made the decisions about the pardons, executive orders, legislation, and proclamations.” Legal experts told PolitiFact there is no constitutional way to overturn a pardon. NBC reported on 4 Mar 2026 that DOJ had shelved its autopen investigation. The guide found no court ruling against any Biden pardon; a viral “vacated” claim in Jan 2026 was satire. After the Senate committee’s Aug 2026 contempt referral, DOJ said it was “reviewing it”. The WSJ later reported the effort had stalled, and no charge has been reported. sourcesourcesourcesourcesourcesource
Simple Man's Vaccine Guide
Official figures and sources, side by side. You decide.
Childhood vaccines and the diseases they target, from the official record
What this is: the main facts about each childhood vaccine and the disease it targets, in one place, each number linked to the official document it came from. Pick a disease below, or jump to death rates or ingredients. Use the UK/US switch at the top.
How to read it
Every figure is followed by a source chip. Open it to see the original document.
Use Show: UK / US / Both in the bar above to switch country.
Labels you will see:
Guide's own calculation
Gap / not found
Retracted
mRNA
⚠ small numbers
Latest news
Stories from the news that bear on the topics in this guide, newest first. Each one links to the original. A summary says what that source reports; this guide has not verified the source's claims, and it takes no position.
Zero Hedge (an opinion piece by Benjamin Bartee, first published on Armageddon Prose) reports that authorities in Guinea-Bissau refused the permits for a US-funded Danish trial of the hepatitis B birth dose, in which 7,000 newborns would have been vaccinated at birth and 7,000 at six weeks, so the trial will not go ahead. The article says the World Health Organization had opposed the design, and argues the aim was to stop a study of vaccine side effects in babies; the article's own claims about pressure on Guinea-Bissau are its opinion, not sourced fact.
A very contagious virus causing fever and rash; can cause pneumonia and brain swelling.
How common now (UK)
2025 958 lab-confirmed cases in England in 2025 (2,911 in 2024). 3 measles-related deaths registered in England & Wales in 2025 (1 acute child death in a child with an immune problem; 2 adult late effects). source
How common now (US)
2025 2,289 confirmed cases in 2025 (incl. 26 international visitors); 3 deaths. (CDC's NNDSS summary table gives 1,975 for 2025 - different counting.) source
How often it kills
1 to 3 of every 1,000 children with measles die (US). source
Treatment if caught
No specific antiviral. Supportive care; CDC advises vitamin A for children with measles. source
Vaccinated vs unvaccinated
US 2025: 93% of cases unvaccinated or unknown status, 3% one MMR dose, 4% two doses. source England Jan-Mar 2025: 226 confirmed cases. 'Six cases (2.7%) had been previously vaccinated with one dose of the MMR vaccine and 5 (2.2%) with at least two doses.' source About 95% of children develop antibodies after one dose at 12 months, over 99% after two doses. source
Before vaccines vs now
pre-vaccine vs 2025 US 20th-century annual average: 530,217 reported cases (estimated true 3-4 million/yr) vs 1,975 reported in 2025. source pre-vaccine England & Wales 1940-1967 (before vaccine, 1968): typically 160,000-760,000 notifications and 30-1,100 deaths a year; e.g. 1967: 460,407 notifications, 99 deaths. source
Itchy blister rash, usually mild in children; can cause skin infections, pneumonia, brain swelling. Now routine in UK (MMRV from Jan 2026) and US.
How common now (UK)
2004-2017 Not a notifiable disease in England, so no case count. England averaged 4,694 varicella hospital admissions/year (2004-2017); an earlier analysis estimated 18.5 deaths/year (2004-2013). sourcesource 2
About 1 per 100,000 cases in children 1-14; 6 per 100,000 aged 15-19; 21 per 100,000 in adults (pre-vaccine US data). Newborns whose mother has chickenpox around delivery: up to 30% if antivirals not given. source
Treatment if caught
Usually supportive; antivirals (e.g. acyclovir) for severe disease/high-risk people. source
Vaccinated vs unvaccinated
1 dose: 82% effective vs any chickenpox, 98% vs severe; 2 doses: 92% vs any chickenpox. source
Before vaccines vs now
pre-vaccine vs 2022 US pre-vaccine estimate 4,085,120 cases/yr vs 34,238 (2022): 99% decrease; ~10,500 hospitalisations/yr pre-vaccine. source
Bacterial infection with long coughing fits; most dangerous for babies under 6 months.
How common now (UK)
2024 14,879 lab-confirmed cases in England in 2024 (highest since 1994); 11 infant deaths. source
How common now (US)
2024 35,435 cases in 2024 (provisional) with 10 deaths (6 infants); 28,132 reported in 2025. sourcesource 2
How often it kills
US 2000-2017: 307 deaths; pneumonia in 13.2% of all cases and 18.6% of infants <6 months. No single CFR given. source US 2024: infants <6 months had the highest hospitalisation rate (33.4%). source
Treatment if caught
Mainly supportive; antibiotics (azithromycin, clarithromycin, erythromycin) help most if started early and reduce spread. source
Vaccinated vs unvaccinated
Vaccination in pregnancy (England): 91.5% effective vs infant death, 88.2% vs hospitalisation, 84.6% vs confirmed disease in infants <3 months. source England: 26 of 32 infant deaths since 2013 were in babies whose mothers were not vaccinated in pregnancy. source Infant DTaP efficacy 80-85% (trials). source
Before vaccines vs now
pre-vaccine vs 2025 US 20th-century annual average 200,752 cases vs 28,132 in 2025 (86% decrease). source
Blood-borne liver virus; babies infected at birth usually become lifelong carriers, risking cirrhosis and liver cancer.
How common now (UK)
2022 239 acute hepatitis B diagnoses reported in England in 2022 (average 342 a year, 2015-2022); ~268,767 people living with chronic hep B (0.58%, 2021 estimate); 0.4% of pregnant women screened positive (2023-24). sourcesource 2
Up to 90% of infants infected at birth become chronically infected; 30-50% if infected age 1-5; ~5% in adults. source
Treatment if caught
Acute: supportive. Chronic: monitoring and antiviral medicines. Babies of infected mothers get vaccine plus hepatitis B immune globulin at birth. source
Vaccinated vs unvaccinated
Over 90% of infants, children, teenagers and healthy adults under 40 make protective antibodies after the full series; 80-100% effective at preventing infection or clinical hepatitis. source
Before vaccines vs now
pre-vaccine vs 2021 US pre-vaccine estimate 66,232 acute cases/yr vs 13,300 (2021 estimate): 80% decrease. source
Bacteria causing meningitis and blood poisoning (sepsis); can kill within hours.
How common now (UK)
2023-24 England 2023-24: 341 invasive meningococcal cases, 301 (88%) group B; 8 deaths (provisional CFR 2.3%). source
How common now (US)
2023 437 meningococcal cases (all groups) in 2023, 0.13 per 100,000; CFR 10.5%. MenB is not routine for all US children (shared decision, age 16-23). source
How often it kills
Overall CFR 10-15% even with antibiotics; up to 20% of survivors have lasting damage (hearing loss, brain damage, limb loss). source
Treatment if caught
Emergency antibiotics (e.g. ceftriaxone, penicillin) in hospital. source
Vaccinated vs unvaccinated
Bexsero in England: early estimate 82.9% effective after 2 doses (study reports range up to 94.2%). source
Antibiotics. CDC: some strains resist one or more antibiotics, which 'can lead to treatment failures'. source
Vaccinated vs unvaccinated
PCV13 in adults 65+ (trial): 75% efficacy vs vaccine-type invasive disease. source US under-5 invasive disease: 16,069/yr pre-vaccine vs ~900 now (94% fall). source
Before vaccines vs now
pre-vaccine vs 2021 US pre-vaccine estimate 63,067 invasive cases/yr (all ages) vs 17,400 (2021); under 5: 16,069 vs 900; ~200 child deaths/yr pre-vaccine. sourcesource 2
US: 84% (RotaTeq) and 83% (Rotarix) effective vs ER visit or hospitalisation. source England: 77-88% fewer infant infections in 5 years after vaccine introduction (2013). source
Before vaccines vs now
pre vs post vaccine England & Wales lab reports: 14,950 in 2013 (pre-vaccine) vs 2,705 in 2016. source pre-vaccine vs 2022 US: 62,500 hospitalisations/yr (<3 years) pre-vaccine vs 18,400 (2022). source
Very common sexually transmitted virus; some types cause cervical and other cancers and genital warts.
How common now (UK)
2019-2024 3,299 new cervical cancer cases a year (2019, 2021-22) and 880 deaths a year (2022-24), UK. source
How common now (US)
recent annual estimate About 49,908 HPV-associated cancers a year, incl. 12,287 cervical (≈11,100 attributable to HPV). source
How often it kills
Not applicable as a single figure - infection usually clears; harm is cancer years later. source
Treatment if caught
No treatment for the infection itself; warts, pre-cancers and cancers are treated. Screening prevents most cervical cancers. source
Vaccinated vs unvaccinated
England: 87% lower cervical cancer in women offered vaccine at 12-13 vs unvaccinated cohorts (97% lower CIN3). sourcesource 2 US: within 10 years, vaccine-type HPV prevalence down 86% in females 14-19. source
Before vaccines vs now
pre-vaccine US pre-vaccine (2003-06): an estimated 79 million infected; 14 million new infections/yr. source
Seasonal respiratory virus; most serious in the very old, very young and people with health conditions.
How common now (UK)
2024-25 Estimated 53 flu-related deaths in children under 18 in England, 2024-25 season (35 in 2023-24). source
How common now (US)
2024-25 280 flu-associated child deaths in 2024-25 season. Annual deaths, all ages: 12,447-61,099 (2010-2019 seasons). sourcesource 2
How often it kills
Varies widely by season and age; most deaths in people 65+. source
Treatment if caught
Antiviral medicines (e.g. oseltamivir) for some patients; supportive care. source
Vaccinated vs unvaccinated
US 2024-25: of 208 child deaths with known status (age 6 months+), 89% were not fully vaccinated. source Vaccine effectiveness 19-60% (2010-11 to 2018-19 seasons), varying by strain match. source
Respiratory virus. UK offers the vaccine only to at-risk groups; US lists it as 'shared clinical decision-making' for children.
How common now (UK)
2020-21 Not on UK routine childhood schedule. England, Mar 2020-Feb 2021: 25 deaths of under-18s were due to COVID-19 (of 61 who died with a positive test), out of 12.0 million children. source
How common now (US)
2024-25 187 COVID deaths in under-18s (July 2024-June 2025). Highest child hospitalisation rate in infants <6 months: 285.6 per 100,000. source
How often it kills
England under-18s, Mar 2020-Feb 2021 (wild-type and Alpha variants): infection fatality rate about 5 per 100,000 infected (0.005%); 99.995% of those with a positive test survived. source US: GAP - no case-fatality rate for children found in a primary source.
Treatment if caught
Antivirals for people at high risk of severe illness: Paxlovid (age 12+), remdesivir (adults and children), molnupiravir (adults), started within 5-7 days of symptoms. source
Vaccinated vs unvaccinated
US infants <6 months hospitalised Oct 2022-Apr 2024: 87.5% had mothers not vaccinated in pregnancy; all 9 in-hospital deaths were in that group (share of cases, not a risk ratio). source
Common winter virus; can cause bronchiolitis and breathing trouble in babies. Protected by a vaccine in pregnancy (UK and US) or an antibody shot for babies (US).
How common now (UK)
pre-2024 / 2025-26 Before the vaccine: about 30,000 hospitalisations of under-5s a year in the UK and 20-30 infant deaths. 2025-26: 50% fewer infants under 6 months in intensive care with RSV in England than the season before. sourcesource 2
How common now (US)
annual estimate 58,000-80,000 RSV hospitalisations a year in children under 5. sourcesource 2
How often it kills
UK: 20-30 infant deaths a year (pre-vaccine); no case-fatality rate published. US: GAP - no annual RSV death count or CFR for children found in a primary source. source
Treatment if caught
Supportive care; CDC: most hospitalised patients 'improve with supportive care and are discharged in a few days'. source
Vaccinated vs unvaccinated
Nirsevimab (antibody): 90% effective vs RSV hospitalisation in infants' first season (early estimate). source Maternal Abrysvo (UK, 2024-25): 58% effective vs infant RSV hospitalisation, 72% if given >14 days before birth. sourcesource 2 UK 2025-26: 61% effective vs hospital admission in infants up to 6 months, 76% up to 3 months. source US infants 0-7 months: RSV hospitalisation rate 43% lower in 2024-25 than 2018-20. source
Vitamin D drops (usually cholecalciferol, vitamin D3) are advised for breastfed babies from birth, to prevent rickets. Shown here next to vitamin K, the other newborn supplement in this guide.
What is given, and how
NHS advises that breastfed babies "should be given a daily vitamin D supplement from birth, whether or not you're taking a supplement containing vitamin D yourself". NHS says the drops can be bought "at pharmacies and supermarkets". sourcesource 2
The UK Healthy Start leaflet says its drops "should be given by mouth (orally)", 5 drops once daily. source
NIH ODS reports that supplements contain vitamin D2 (ergocalciferol) or D3 (cholecalciferol); D3 "is typically produced with irradiation of 7-dehydrocholesterol from lanolin obtained from the wool of sheep", and a lichen-sourced D3 also exists. source
The Australasian Neonatal Medicines Formulary lists two routes for newborn colecalciferol, oral and intramuscular. Its prevention dose is 400 units a day by mouth. Intramuscular use is listed for treating rickets: "If oral administration is difficult, consider intramuscular vitamin D3 100,000 units (colecalciferol 2.5 mg) every 3 months (3 doses)." The injectable product it names holds 600,000 units per mL. source
The 2016 global consensus on rickets describes "stoss therapy" as "the administration of a large dose given as a single dose or in divided doses over several days". It recommends daily treatment first but says "in some situations, stoss therapy may be more practical". On route, it says: "We recommend oral treatment, which more rapidly restores 25OHD levels than IM treatment." These are treatment doses for rickets, not routine newborn doses. source
Thailand: a 2021 Thai trial reports that "routine vitamin D supplementation for exclusively breastfed infants has not been widely practiced" in Thailand and that "the local healthcare authorities have not established a national consensus". It also says no infant vitamin D-only product was on sale in Thailand when the study was done, so it used a multivitamin drop. source
A 2024 Bangkok study states: "in Thailand, no advice for routine vitamin D supplementation is available." source
GAP: this guide found no published source saying that Thai hospitals routinely give vitamin D as an injection on the day of birth, and no national Thai policy saying so. Practice may vary by hospital. The product name and dose on a baby's hospital discharge record would show what was given.
Recommended dose and why (UK and US)
UK (NHS / Department of Health and Social Care): babies from birth to 1 year who are breastfed "should be given a daily supplement containing 8.5 to 10 micrograms of vitamin D". Babies having more than 500ml of infant formula a day should not be given one, because formula is already fortified. source
NICE CKS gives the same UK dose in units: 8.5-10 micrograms is 340-400 international units (IU) a day. (1 microgram = 40 IU.) sourcesource 2
US (AAP): "Vitamin D supplements of 400 IU (10 mcg) per day are recommended for babies up until age one year." source
CDC: the AAP and the Dietary Guidelines for Americans "recommend that breastfed and partially breastfed infants receive 400 International Units (IU) of vitamin D daily beginning in the first few days of life." source
Why: the AAP's clinical report is titled "Prevention of Rickets and Vitamin D Deficiency in Infants, Children, and Adolescents". CDC states that vitamin D "helps prevent rickets, a condition that causes weak or deformed bones." sourcesource 2
NHS describes rickets as a condition caused by a lack of vitamin D or calcium; it says the main symptom is bowed legs. source
The 2016 global consensus states: "400 IU/d (10 μg) is adequate to prevent rickets and is recommended for all infants from birth to 12 months of age, independent of their mode of feeding." source
How common rickets is: NIH ODS reports 24.1 cases per 100,000 children under 3 in one Minnesota county (2000s), mainly in breastfed Black children, and 2.9 per 100,000 children under 7 in Canada (2002-2004), where "almost all patients with rickets had been breastfed". source
Ingredients in the drops (from manufacturers' leaflets and labels)
Enfamil D-Vi-Sol (US): 10 mcg (400 IU) vitamin D per 1 mL. Other ingredients: "Glycerin, water, polysorbate 80 (emulsifier), citric acid (antioxidant for vitamin D), natural flavor, sodium citrate." source
Baby Ddrops: 400 IU per drop, "made with only two naturally sourced ingredients, pure vitamin D3 and organic fractionated coconut oil". The maker states it is free from preservatives. source
Healthy Start children's vitamin drops (UK government scheme): 5 drops contain vitamin D 7.5 micrograms (300 IU), vitamin A 233 micrograms and vitamin C 20 mg. Other ingredients: "water, glycerol, polysorbate 80, banana flavour, alpha-tocopherol, Medium Chain Triglycerides." (This leaflet was last approved in 05/2018.) source
The ANMF notes that some vitamin D preparations contain sodium benzoate, and advises: "Avoid exposure to sodium benzoate of >99 mg/kg/day in neonates." source
The Thai trial used Munti-Vim multivitamin drops (B.L. Hua, Bangkok), with 400 IU vitamin D3 per mL plus vitamins A, B1, B2, B6, B12, C, nicotinamide and dexpanthenol. source
Cholecalciferol as a rat poison (EPA)
US EPA: "Cholecalciferol is vitamin D3, which in small dosages is needed for good health in most mammals, but in massive doses is toxic, especially to rodents." source
EPA's label database lists Cholecalciferol Blox (EPA Reg. No. 12455-162), a registered rat and mouse bait, with cholecalciferol at 0.075% as the active ingredient. source
An EPA risk assessment memo states that cholecalciferol works as a rodenticide by mobilising "calcium from bones into the blood plasma causing hypercalcemia". The same memo notes that it is a nutrient permitted as a food additive and is generally recognised as safe as a dietary supplement "within specific limitations". source
NPIC reports that cholecalciferol was first registered as a rodenticide in the US in 1984. "The body's ability to maintain proper calcium levels must be overwhelmed before cholecalciferol becomes toxic. Rodents must eat several doses." It adds that "poisonings of people are very rare." source
This guide's own arithmetic 0.075% means 0.75 mg of cholecalciferol per gram of bait, which is 750 micrograms, or 30,000 IU. One infant daily dose is 10 micrograms (400 IU). So 1 gram of bait holds about 75 infant daily doses, and one infant daily dose equals the vitamin D in about 13 mg of bait. sourcesource 2
This guide's own arithmetic Concentration compared: D-Vi-Sol has 10 micrograms per mL. The bait (750 micrograms per gram) is about 75 times as concentrated, taking 1 mL as about 1 gram. The newborn injection product named by the ANMF (600,000 units/mL = 15 mg/mL) is about 20 times as concentrated as the bait. The effect depends on the total amount swallowed or injected, not on concentration alone. sourcesource 2
Too much vitamin D in infants: evidence, warnings and recalls
Upper limits: NIH ODS gives the US upper intake level as 1,000 IU (25 mcg) a day for 0-6 months and 1,500 IU (38 mcg) for 7-12 months. NHS says infants under 12 months "should not have more than 25 micrograms (1,000 IU) a day". sourcesource 2
NIH ODS: too much vitamin D causes high blood calcium, which can lead to nausea, vomiting, muscle weakness, dehydration and kidney stones, and in extreme cases kidney failure, heart rhythm problems and death. It says toxicity has been caused by supplements with excess vitamin D "because of manufacturing errors", supplements taken in excessive amounts, and wrong prescriptions. It also says too much sun does not cause vitamin D toxicity. source
The ANMF reports that 1,600 units/day of vitamin D3 "produced vitamin D toxicity (hypercalcaemia and 25OH vitamin D >250 nmol/L) in 94% of healthy, term, breastfed infants" in the study it cites, and that a single 600,000-unit dose in infants "produced prolonged vitamin D excess and transient hypercalcaemia, whereas doses of 100,000 to 200,000 units every 3 months did not." source
In a stoss-therapy study cited by the 2016 consensus, 56 Turkish children aged 3-36 months were given single oral doses of 150,000, 300,000 or 600,000 IU, and eight developed high blood calcium (two in the 300,000 group, six in the 600,000 group). source
2010 FDA, June 2010: FDA had seen "an increase in the number of liquid vitamin D dietary supplements being marketed that could lead to infants receiving an unsafe amount of vitamin D", because droppers could hold more than an infant should get. It recommended that droppers for infant products "hold no more than 400 units". source
2024 Recall, February 2024 (FDA notice): Nordic Naturals recalled one lot (234909) of Baby's Vitamin D3 Liquid, about 3,800 units, after "a manufacturing error that resulted in an elevated level of Vitamin D3 dosage". The company reported no adverse events at that time. source
Case report (US): a 3-month-old was given 1 mL a day of a new product that held 400 IU per drop rather than per mL. That came to 12,000 IU a day, a 30-fold overdose, for 20 days. The authors say the infant was "clinically stable with no symptoms" when the error was found. source
2023 France (ANSES, 2023): ANSES received three reports in 2022 of severe high blood calcium in infants who were given internet-bought food supplements containing 5,000-10,000 IU per drop, in one case 40,000 IU a day. The reports included kidney calcium deposits (nephrocalcinosis) and, in one infant, an ECG abnormality. ANSES advises against replacing medicinal vitamin D with a food supplement. source
2022 Case report (France, 2022): a 3-month-old developed severe high blood calcium after the parents, on a midwife's advice, swapped the prescribed medicinal vitamin D for a "natural" dietary supplement of a different concentration. source
Natural sources, D2 versus D3, and breast milk
Sunlight: NIH ODS explains that UVB light (about 290-320 nm) on bare skin turns 7-dehydrocholesterol into previtamin D3, which becomes vitamin D3. UVB does not pass through glass. source
NIH ODS reports that the AAP advises keeping infants under 6 months out of direct sunlight. NHS says: "Young children should still have vitamin drops, even if they get out in the sun." sourcesource 2
A Bangkok study of 109 exclusively breastfed 4-month-olds found 35.78% vitamin D deficient and 33.03% insufficient. Their "sun index showed no correlation with the 25-OH vitamin D level". source
Foods (NIH ODS table, per serving): farmed rainbow trout, 3 oz cooked: 645 IU; sockeye salmon, 3 oz cooked: 570 IU; one large egg: 44 IU ("Vitamin D is in the yolk"); white mushrooms exposed to UV light, ½ cup: 366 IU (vitamin D2); ordinary portabella mushrooms, ½ cup: 4 IU. source
D2 versus D3: Tripkovic 2012 (meta-analysis) concluded that "vitamin D3 is more efficacious at raising serum 25(OH)D concentrations than is vitamin D2". The difference was significant with a bolus dose, "but the effect was lost with daily supplementation". The authors said effects "across age, sex, and ethnicity" could not be checked. source
The 2016 global consensus states: "For daily treatment, both D2 and D3 are equally effective" and "When single large doses are used, D3 appears to be preferable compared to D2 because the former has a longer half-life." NIH ODS says the two forms "seem to have equivalent ability to cure rickets". sourcesource 2
Breast milk: NIH ODS states that "consumption of human milk alone does not ordinarily enable infants to meet vitamin D requirements, because it provides less than 0.6 to 2.0 mcg/L (25 to 78 IU/L)", and that the level depends on the mother's vitamin D status. CDC: "Breast milk alone does not provide infants with enough vitamin D." sourcesource 2
This guide's own arithmetic At the top of that range (78 IU per litre), a baby would need to drink more than 5 litres of breast milk a day to get 400 IU. source
Mother's supplements: NIH ODS reports that breast milk from mothers taking at least 2,000 IU of D3 a day has higher levels, and CDC says families can discuss maternal high-dose supplements with a provider. The 2016 consensus recommends: "Lactating women should not take high amounts of vitamin D as a means of supplementing their infant." sourcesource 2
Main figure: deaths per 100,000 of the whole population per year, from official death registrations: ONS for England and Wales (the UK column) and CDC WONDER for the US. They are split into vaccinated and unvaccinated people only where an official body has published that split. Otherwise it says "not published"; this guide never calculates a split. The ICD-10 code under each figure shows which causes of death were counted.
The difference: Deaths per 100,000 of the whole population per year counts everyone, including people who never caught the disease, so it shows how many people the disease kills in a country each year; deaths per 100,000 who caught it shows how dangerous it is once you have it.
Small case numbers make some rates unreliable; those figures are flagged ⚠ (under 20 deaths, the threshold CDC WONDER uses for "unreliable").
Disease
UK: deaths per 100,000 people per year (England and Wales)
0 (0 deaths) ⚠ small numbers 2022 · ICD-10 B05 · calculated by this guide: ONS death count / ONS mid-2022 population (60,238,038) x 100,000 sourcepopulation
0 (0 deaths) ⚠ small numbers 2024 · ICD-10 B05 · CDC WONDER: zero deaths source
not published
100-300 per 100,000 cases (1-3 per 1,000) source Unvaccinated: not published · Vaccinated: not published general US estimate · children, US
0.0017 (1 deaths) ⚠ small numbers 2022 · ICD-10 B26 · calculated by this guide: ONS death count / ONS mid-2022 population (60,238,038) x 100,000 sourcepopulation
0 (0 deaths) ⚠ small numbers 2024 · ICD-10 B26 · CDC WONDER: zero deaths source
not published
No figure published (deaths 'very rare') source Unvaccinated: not published · Vaccinated: not published - · all ages, US
0.0033 (2 deaths) ⚠ small numbers 2022 · ICD-10 B06, P35.0 · calculated by this guide: ONS death count / ONS mid-2022 population (60,238,038) x 100,000 sourcepopulation
0 (0 deaths) ⚠ small numbers 2024 · ICD-10 B06 · CDC WONDER: zero deaths source
not published
No figure published source Unvaccinated: not published · Vaccinated: not published - · -
0.0166 (10 deaths) ⚠ small numbers 2022 · ICD-10 B01 · calculated by this guide: ONS death count / ONS mid-2022 population (60,238,038) x 100,000 sourcepopulation
0.0033 (2 deaths) ⚠ small numbers 2022 · ICD-10 A37 · calculated by this guide: ONS death count / ONS mid-2022 population (60,238,038) x 100,000 sourcepopulation
0.0017 (1 deaths) ⚠ small numbers 2022 · ICD-10 A36 · calculated by this guide: ONS death count / ONS mid-2022 population (60,238,038) x 100,000 sourcepopulation
0 (0 deaths) ⚠ small numbers 2024 · ICD-10 A36 · CDC WONDER: zero deaths source
not published
5,000-10,000 per 100,000 (5-10%) source Unvaccinated: not published · Vaccinated: not published general estimate · all ages, US
0 (0 deaths) ⚠ small numbers 2022 · ICD-10 A33-A35 · calculated by this guide: ONS death count / ONS mid-2022 population (60,238,038) x 100,000 sourcepopulation
not shown (1-9 deaths; CDC suppresses counts under 10)⚠ small numbers 2024 · ICD-10 A33,A34,A35 source
not published
11,000 per 100,000 (11%); 12,400 per 100,000 (12.4%, 37 of 299) sourcesource 2⚠ Unvaccinated: 15,000 per 100,000 (15%) source · Vaccinated: 1-2 doses: 6,000 per 100,000 (6%). 3+ doses: 0 deaths among 16 patients. (2009-23 report: no deaths among those with 3+ doses.) source 1995-97; 2009-23 · all ages, US 2009-23 figures from the later MMWR report; it does not give an unvaccinated rate.
0.0033 (2 deaths) ⚠ small numbers 2022 · ICD-10 A80 · calculated by this guide: ONS death count / ONS mid-2022 population (60,238,038) x 100,000 sourcepopulation
0 (0 deaths) ⚠ small numbers 2024 · ICD-10 A80 · CDC WONDER: zero deaths source
not published
2,000-5,000 per 100,000 children; 15,000-30,000 adolescents/adults source Unvaccinated: not published · Vaccinated: not published general estimate · by age
0 (0 deaths) ⚠ small numbers 2022 · ICD-10 G00.0 (Hib meningitis only) · calculated by this guide: ONS death count / ONS mid-2022 population (60,238,038) x 100,000 sourcepopulation
not shown (1-9 deaths; CDC suppresses counts under 10)⚠ small numbers 2024 · ICD-10 G00.0 source
not published
3,000-6,000 per 100,000 (3-6%) source Unvaccinated: not published · Vaccinated: not published pre-vaccine era · children, US
0.0050 (3 deaths) ⚠ small numbers 2022 · ICD-10 B15 · calculated by this guide: ONS death count / ONS mid-2022 population (60,238,038) x 100,000 sourcepopulation
300-600 per 100,000 (0.3-0.6%); up to 1,800 in adults 50+ source Unvaccinated: not published · Vaccinated: not published general estimate · all ages, US
0.0614 (37 deaths) 2022 · ICD-10 B16, B18.0, B18.1 · calculated by this guide: ONS death count / ONS mid-2022 population (60,238,038) x 100,000 sourcepopulation
0.2 (144 deaths) 2025 · ICD-10 A39, G00-G03 (meningococcal infection and all meningitis) · ONS published crude rate (all ages excluding under 1) source
0.2 (144 deaths) 2025 · ICD-10 A39, G00-G03 (meningococcal infection and all meningitis) · ONS published crude rate (all ages excluding under 1) source
0.1411 (85 deaths) 2022 · ICD-10 A40.3, G00.1, J13 · calculated by this guide: ONS death count / ONS mid-2022 population (60,238,038) x 100,000 sourcepopulation
0 (0 deaths) ⚠ small numbers 2022 · ICD-10 A08.0 · calculated by this guide: ONS death count / ONS mid-2022 population (60,238,038) x 100,000 sourcepopulation
not shown (1-9 deaths; CDC suppresses counts under 10)⚠ small numbers 2024 · ICD-10 A08.0 source
not published
No rate published (US: 20-60 child deaths a year before vaccine) source Unvaccinated: not published · Vaccinated: not published pre-vaccine · under 5, US
UK: unvaccinated 46.1 per 100,000 person-years (45 deaths); vaccinated 22.7 ever vaccinated; 21.6 with 4th dose 21+ days ago May 2023 (England, all ages, age-standardised; deaths involving COVID-19) ⚠ small numberssource
US: unvaccinated 1.6 to 15.8 per 100,000 per WEEK (average weekly, range across variant periods); vaccinated 0.3 to 1.4 per 100,000 per week (monovalent vaccine only); 0.1 bivalent booster (late BA.4/BA.5) Oct 2021 - Dec 2022 (24 US jurisdictions, age 12+, age-standardised) source
About 5 per 100,000 infected (0.005%) source⚠ Unvaccinated: not published · Vaccinated: not published Mar 2020-Feb 2021 (before child vaccination) · under 18, England Vaccinated/unvaccinated split cannot apply: children were not yet vaccinated in this period. Based on 25 deaths.
0.0282 (17 deaths) ⚠ small numbers 2022 · ICD-10 J12.1, J20.5, J21.0 · calculated by this guide: ONS death count / ONS mid-2022 population (60,238,038) x 100,000 sourcepopulation
0 (0 deaths) ⚠ small numbers 2022 · ICD-10 P53 · calculated by this guide: ONS death count / ONS mid-2022 population (60,238,038) x 100,000 sourcepopulation
0 (0 deaths) ⚠ small numbers 2024 · ICD-10 P53 · CDC WONDER: zero deaths source
not published
23,000 per 100,000 (23%, 11 of 47) source⚠ Unvaccinated: not published · Vaccinated: not published 5-year study · infants with late VKDB, Egypt Split by vitamin K shot status not published in this study.
Excess deaths since 2020
"Excess deaths" means deaths registered above the number expected. The expected number depends on the method, so different official bodies give different totals for the same year.
These headline figures (ONS age-standardised mortality rates, CDC age-adjusted rates, and the post-2024 ONS and OHID baselines) already account for population ageing and growth. ONS: 'Unlike the current method, the new method accounts for trends in population size, age structure and mortality rates.' source
ONS changed its method in February 2024. The old method used a simple 5-year average of deaths; the new one uses a model that accounts for population size, age and trends. Whole UK, both methods: source
Year (UK)
Old method (5-year average)
New method (95% confidence interval)
2019
6,006
-34,408 (95% CI -38,973 to -29,843)
2020
84,064
76,412 (72,453 to 80,371)
2021
61,907
55,079 (48,172 to 61,987)
2022
38,960
43,456 (32,124 to 54,789)
2023
31,442
10,994 (8,719 to 13,269)
England 2023, OHID new method (rolling 5-year trend baseline, revised population): 10,890 excess deaths (2% higher than expected). source
OHID: 'The flatter gradient leads to higher expected deaths and therefore lower excess deaths.' OHID paused its report after May 2026 because 'ONS and OHID adopted a similar excess mortality methodology'. sourcesource 2
Scotland and Northern Ireland publish their own figures (National Records of Scotland, NISRA); they are included only in the whole-UK ONS row above.
CDC's official weekly excess-deaths estimates stopped in September 2023: 'Effective September 27, 2023, this dataset will no longer be updated. Similar data are accessible from wonder.cdc.gov.' This guide therefore shows CDC's age-adjusted death rates rather than an excess count for the US, and does not calculate one. source
Excess broken down by cause of death
England 2023, OHID official estimate by underlying cause (age- and population-adjusted baseline) source
Cause
Excess deaths 2023
vs expected
Influenza and pneumonia
7,791
+52%
Chronic lower respiratory diseases
5,363
+22%
Dementia and Alzheimer's
4,827
+8%
Circulatory diseases (all)
2,239
+2%
of which cerebrovascular (stroke)
1,231
+5%
of which ischaemic heart disease
-193
0%
Cancer
1,593
+1%
Cirrhosis and other liver diseases
-197
-2%
All causes (total)
10,890
+2%
OHID: "the causes in the table do not sum to the total: some causes are missing". OHID dropped diabetes from its cause list because, as an underlying cause, the numbers were too small. Its earlier report, based on any mention on the death certificate, is not comparable.
England and Wales: deaths by cause group, 2019-2025 (registered deaths; counts, not adjusted for age or population, and not excess estimates) source
Cause group (ICD-10)
2019
2020
2021
2022
2023
2024
2025
Infectious and parasitic diseases (A00-B99; excludes COVID-19)
5,113
4,332
5,484
6,793
7,714
8,007
8,383
Circulatory (I00-I99)
129,421
132,857
134,405
140,506
140,487
135,151
133,527
Respiratory (J00-J99; includes flu and pneumonia)
72,440
61,979
54,832
63,945
71,235
68,851
69,613
Endocrine, nutritional and metabolic, incl. diabetes (E00-E90)
8,873
9,974
9,827
10,600
10,720
10,765
11,926
Cancer and other neoplasms (C00-D48)
150,865
151,116
148,359
152,831
152,748
152,842
152,979
Nervous system, incl. Alzheimer's (G00-G99)
35,987
40,629
37,902
41,381
42,726
44,581
49,192
Mental and behavioural, incl. dementia (F00-F99)
47,201
47,654
41,087
44,077
44,018
43,611
44,279
External causes: accidents, suicide, etc. (V01-Y89)
22,894
22,326
23,319
25,024
27,502
27,530
27,573
COVID-19 (U codes)
0
73,767
67,369
22,485
11,847
6,636
3,095
US: age-adjusted death rate per 100,000 by cause, 2019-2024 (CDC does not publish an excess figure by cause after September 2023) source
Cause (ICD-10)
2019
2020
2021
2022
2023
2024
Infectious and parasitic diseases (A00-B99; excludes COVID-19)
16.2
16.8
17.1
16.9
16.6
15.8
Circulatory (I00-I99)
214.6
224.4
233.3
224.3
218.3
212.9
Respiratory (J00-J98)
66.4
65.0
61.9
62.0
61.0
59.8
Diabetes (E10-E14)
21.6
24.8
25.4
24.1
22.4
21.7
Cancer and other neoplasms (C00-D48)
150.0
148.1
150.6
146.1
145.6
143.2
External causes (V01-Y89)
72.5
82.3
90.5
88.9
86.1
75.5
COVID-19 (U07.1)
-
85.0
104.1
44.5
11.9
7.3
All causes
715.2
835.4
879.7
798.8
750.5
722.1
Infectious-disease share of the excess
England 2023 (OHID): OHID's cause groups have no 'infectious diseases' group and do not include COVID-19. The one infection group shown, influenza and pneumonia, had 7,791 excess deaths out of 10,890 for all causes (OHID notes the causes 'do not sum to the total'). source
That is about 72% (7,791 / 10,890, calculated by this guide from the OHID figures; because OHID's groups are not additive, this is a rough indication, not an official share). (calculated by this guide)
England and Wales, ICD-10 chapter 1 (infectious and parasitic diseases, which excludes COVID-19 and flu/pneumonia): registered deaths 5,113 in 2019; 4,332 in 2020; 5,484 in 2021; 6,793 in 2022; 7,714 in 2023; 8,007 in 2024; 8,383 in 2025. These are counts, not adjusted for age or population, and not excess estimates. ONS does not publish an excess estimate for this chapter. source
Within that chapter, most of the 2019-2022 rise was sepsis (A40-A41: 2,453 in 2019; 3,761 in 2022). TB, malaria and measles were each under 200 deaths a year (see the table below). source
US: no official excess-by-cause series after September 2023, so no official infectious share is published. Age-adjusted death rate for infectious and parasitic diseases (A00-B99, excludes COVID-19): 16.2 per 100,000 in 2019, 15.8 in 2024. COVID-19 (U07.1): 85.0 in 2020, 104.1 in 2021, 7.3 in 2024. source
England and Wales: infectious-disease deaths by type, 2019-2022 (ONS; underlying cause; latest year in this file is 2022) source
Infection (ICD-10)
2019
2020
2021
2022
Tuberculosis (A15-A19)
156
168
152
169
Malaria (B50-B54) ⚠
12
7
1
6
Measles (B05) ⚠
4
0
1
0
Sepsis (A40-A41)
2,453
1,755
2,897
3,761
HIV (B20-B24)
124
137
142
115
Viral hepatitis (B15-B19)
166
149
175
185
Other bacterial intestinal infections, incl. C. difficile (A04)
404
400
449
543
Viral infection, site unspecified (B34)
58
80
40
75
Late effects of infections, incl. TB (B90-B94)
70
54
38
35
⚠ Rows with fewer than 20 deaths a year are unreliable as rates.
Imported and non-endemic infections, 2020 onwards
Tuberculosis (TB) - England
Notifications: 4,831 in 2023; 5,490 in 2024 (13.6% rise). Share born outside the UK: 73.7% in 2019, 73.2% in 2020, 77.1% in 2021, 79.0% in 2022, 80.0% in 2023, 81.9% in 2024. Rate per 100,000 in 2024: 46.9 for people born outside the UK, 2.1 for UK-born. source
UKHSA on recent arrivals: 'This likely reflects the increased migration from higher incidence countries and effects of global disruptions in TB care due to the COVID-19 pandemic.' (UKHSA links this to TB cases, not to excess deaths.) source
Deaths: of people notified in 2023, '4.6% of people had died at their last reported treatment outcome', down from 'the peak of 6.0% in 2021 for people notified in the peak pandemic year of 2020'. source
Deaths with TB as the underlying cause (A15-A19), England and Wales: 156 in 2019; 168 in 2020; 152 in 2021; 169 in 2022 (latest year in this ONS file). source
Tuberculosis (TB) - US
Cases: 8,895 in 2019; 7,170 in 2020; 7,866 in 2021; 8,335 in 2022; 9,626 in 2023; 10,388 in 2024. Share among non-US-born people: 71.2% in 2019, 77.2% in 2024. Rate per 100,000 in 2024: 15.7 non-US-born, 0.8 US-born. source
Deaths with TB as the underlying cause (A16-A19): 526 in 2019; 600 in 2020; 602 in 2021; 565 in 2022; 572 in 2023; 622 in 2024. CDC: 'the TB death rate has remained stable at 0.2 per 100,000 population.' sourcesource 2
Malaria (not caught in the UK or US; all cases imported)
UK 2023: 2,106 imported cases. 'A total of 6 deaths were reported in 2023, which is the same as the annual average of deaths between 2014 and 2023.' Of cases with travel information, 72% were UK residents travelling abroad (74% of those visiting friends and relatives); 15% were new entrants to the UK (including foreign students); 5% were foreign visitors. source
Deaths with malaria as the underlying cause (B50-B54), England and Wales: 12 in 2019; 7 in 2020; 1 in 2021; 6 in 2022. source⚠ small numbers
US deaths with malaria as the underlying cause (B50-B54): 14 in 2023; 18 in 2024; 2018-2022 not shown by CDC WONDER (fewer than 10 a year, or none). source⚠ small numbers
Measles
England and Wales deaths with measles as the underlying cause (B05): 4 in 2019; 0 in 2020; 1 in 2021; 0 in 2022. source⚠ small numbers
England 2025: 958 lab-confirmed cases (2,911 in 2024); 3 measles-related deaths registered in England and Wales in 2025. source⚠ small numbers
US 2025: 2,289 confirmed cases (including 26 international visitors); 3 deaths. CDC WONDER shows no measles deaths for 2018-2024. source⚠ small numbers
Migration-linked infection as a suggested cause
Not listed as a suggested cause. In the official and peer-reviewed sources checked (ONS, OHID, UKHSA, CDC/NCHS, PubMed searches), none names imported or migration-linked infection as a cause of excess deaths in the UK or US. That does not mean no such source exists. (search done 22 Oct 2026)
Related but different findings: UKHSA links the recent rise in TB cases to migration from higher-incidence countries (see above). A peer-reviewed study found that 'Migrants from 17 of 19 countries/regions examined had higher mortality from COVID-19 than non-migrants' in England and Wales in 2020-2021. Neither source presents migration-linked infection as a cause of the overall excess. sourcesource 2
Flu: deaths, lab tests, and the children's nasal spray
England and Wales: deaths with flu or pneumonia as the underlying cause (ICD-10 J09-J18; deaths registered; counts, not adjusted for age or population)
ONS publishes influenza and pneumonia separately each year (Table 7, all ages excluding under-1s). The 2023 split is available there: 2,179 flu, 22,061 pneumonia (24,240 together, the same total as ONS Table 4). source
The last two columns are this guide's own count from the ONS 21st Century Mortality file (all ages, including babies under 1 but excluding newborns under 28 days, who are not given an underlying cause). That file ends at 2022. (calculated by this guide from raw/ons/21stcmortality.xlsx)
'Flu and pneumonia' is mostly pneumonia: flu itself was between 34 and 4,309 deaths a year in this period. ONS: 'We often count “influenza and pneumonia” together because many cases of pneumonia are in fact caused by influenza.' source
In 2020, deaths due to flu and pneumonia were 'below the five-year average (2015 to 2019) in every month' from January to August (ONS, deaths by date of occurrence). source
Flu in laboratory tests, 2020-2022
England, Respiratory DataMart (hospital and public health laboratories): in winter 2020-21 flu 'detections ... were extremely low, never reaching more than 0.2% of samples tested. This compares to peak positivity of 25.3% in 2019 to 2020 and 28.6% in 2018 to 2019.' source
England, winter 2021-22: flu positivity 'remained low', rising to 1.1% in December 2021, then to 5.3% by early April 2022 ('a late-season increase'). source
England, UKHSA model of flu-attributable deaths (FluMOMO): 9,123 in 2019-20; 0 in 2020-21; 432 in 2021-22; 14,378 in 2022-23; 4,431 in 2023-24; 9,740 in 2024-25; 3,798 in 2025-26. source
US clinical laboratories: share of flu tests positive fell 'from a median of 19.34% to 0.33%' (before vs after 1 March 2020), while the number of specimens tested fell 61%. source
Australia, Chile and South Africa (WHO FluNet), April-July 2020: 51 positive out of 83,307 specimens tested (0.06%), against 13.7% (24,512 of 178,690) in the same months of 2017-2019. source
Australia 2020: 21,266 laboratory-confirmed flu notifications and 37 flu-associated deaths. The report warns that 2020 data 'may not accurately reflect influenza activity' because of distancing, changed health-seeking and 'focussed testing for COVID-19'. source
Note: the swab figures above come from laboratory flu tests, not from death certificates. (note by this guide)
Why flu fell: the two explanations
Both are shown with their sources. This guide does not choose between them.
(a) Official view: distancing and lockdowns stopped flu spreading
CDC (MMWR): the fall 'were attributed to both artifactual changes related to declines in routine health seeking for respiratory illness as well as real changes in influenza virus circulation because of widespread implementation of measures to mitigate transmission of SARS-CoV-2.' source
UKHSA: the small rise in December 2021 then fall 'coincides with the introduction of non-pharmaceutical intervention measures to prevent the spread of the Omicron variant'. source
Australian Department of Health: 'COVID-19 related public health measures and the community's adherence to public health messages are also likely to have had an effect on transmission of acute respiratory infections, including influenza.' source
(b) Critics' view: some flu (and other) deaths were recorded as COVID-19
Published critics (McGowan, Hunt and Mitteldorf, 2023) argue that US CDC guidance from April 2020 'encourages physicians and others to assign COVID-19 as the underlying cause of death in any death where COVID-19 is detected by tests or even just suspected, raising the possibility that heart attack and stroke deaths might be wrongly classified as COVID-19 deaths, as well as the traditional pneumonia and influenza deaths'. source
ONS (England and Wales, Jan-Aug 2020): where both flu/pneumonia and COVID-19 were on the death certificate, COVID-19 was recorded as the underlying cause in 95.8% (18,642 deaths). Pneumonia was mentioned on 69,781 certificates and influenza on 506, against 52,327 for COVID-19, but COVID-19 was the underlying cause in 3.4 times as many deaths. source
UK daily counts: in July 2020 University of Oxford researchers reported that Public Health England counted anyone who had ever tested positive and later died: 'A patient who has tested positive, but successfully treated and discharged from hospital, will still be counted as a COVID death even if they had a heart attack or were run over by a bus three months later.' source
After a review, from 12 August 2020 the UK switched its daily count to deaths within 28 days of a positive test (41,329 UK deaths on that basis at the time). PHE's analysis 'found 96% of deaths occurred within 60 days or had COVID-19 on the death certificate. 88% of deaths occurred within 28 days.' source
No official or peer-reviewed study was found that measures how many flu deaths, if any, were recorded as COVID-19. (search done 22 Oct 2026)
Hospital payments for COVID-19 patients
US (documented): section 3710 of the CARES Act told Medicare to 'increase the weighting factor of the assigned Diagnosis-Related Group (DRG) by 20 percent for an individual diagnosed with COVID-19' during the public health emergency. From 1 September 2020, a positive viral test had to be in the patient's record for the extra payment. source
UK (England): from April 2020 NHS hospital trusts were paid fixed monthly sums: 'Payment will be made on the block basis ... for each month from April to July 2020', instead of payment per contract activity. This guide found no per-case payment for COVID-19 patients in the UK sources checked. source
Children's nasal flu vaccine (Fluenz) and the 2025-26 UK flu season
The vaccine
The children's nasal spray (Fluenz) is the only live flu vaccine used in the UK: 'LAIV contains live viruses that have been attenuated (weakened) and adapted to cold so that they can only replicate at the lower temperatures found in the nasal passage.' source
It is 'the first-line option for most children' in England's programme; children who cannot have it get an injected (inactivated) vaccine. source
The 2025-26 season in the UK
UKHSA: 'the season started in the second half of October 2025 in children and young adults with rising influenza A(H3N2) activity. It peaked around the second week of December (2025) and declined after.' source
UKHSA (Nov 2025): 'Flu activity has risen unusually early this season, with increases first seen in teenagers and young adults, followed by younger children.' source
Lab-test positivity was highest in 5-14 year olds, peaking at 47.4% on 2 December 2025. source
Size compared with other years: 'activity started earlier than in the 2024 to 2025 season but also declined earlier and the overall level of activity over the course of the season was lower'. Flu-attributable deaths in England: 3,798 (2025-26) vs 9,740 (2024-25) and 4,431 (2023-24). Flu-related deaths in under-18s: 36 vs 66, 36 and 89 in the three previous seasons. source
The strain mismatch (subclade K)
Of 1,615 H3N2 viruses sequenced in England, 97.3% were subclade K. Of 293 tested antigenically, 280 (95.6%) were 'antigenically distant' from the 2025-26 vaccine strains. source
ECDC: subclade K was 47% of H3N2 sequences in the EU/EEA and 33% worldwide (May-November 2025), found in 'Oceania, Asia, Africa, Europe and North America'; Hong Kong and Taiwan also had H3N2-dominated epidemics. source
Uptake in children (England, 2025-26)
Age 2-3: 44.2%. School years reception to 11: 52.2% (primary 55.5%, secondary 48.0%). source
How well it worked in children
Early estimate (autumn 2025, ages 2-17, any flu vaccine): 74.8% against emergency-department attendance and 73.8% against hospital admission with flu A; 74.7% and 72.8% against H3N2. source
End of season (ages 2-17): 51.6% against GP-diagnosed flu; 67.9% against hospital admission. source
A published critic asks: 'If nearly half of flu tests in children are positive despite nearly half of children being vaccinated, what does that say about the effectiveness of the vaccine?' source
Did the spray cause or spread the outbreak? (shedding evidence)
UKHSA sequencing: 'Genome sequencing has confirmed the detection of LAIV viruses in 9 influenza A/B positive samples in surveillance samples collected since week 40 2025, all from children aged between 2 and 16 years, consistent with known shedding characteristics of LAIV viruses.' (Compare: 1,615 H3N2 viruses sequenced, 97.3% subclade K.) source
UKHSA: its child flu-death estimates 'may include deaths that are not attributable to influenza infection, including detections due to live-attenuated influenza vaccine (LAIV)'. source
UK shedding study (PHE, 2016-18): the H3N2 vaccine strain was found in the nose of 19.7% and 18.7% of vaccinated children (swabs on days 1, 3 and 6). source
Day-care trial (Finland, under-3s): 80% of vaccinated children shed vaccine virus; one vaccine strain passed to one unvaccinated child; estimated chance of passing it on per close contact 0.58% (95% CI 0-1.7%); 'No clinically significant illness occurred'. source
UK guidance: over 30 million LAIV doses in the UK with 'no reported instances of illness or infections from the vaccine virus among immunocompromised patients inadvertently exposed'. It still notes a 'theoretical potential for transmission of live attenuated influenza virus in LAIV to immunocompromised contacts for 1 to 2 weeks following vaccination'. source
Critics: Children's Health Defense's chief scientific officer: 'Live virus vaccines shed with consequences, especially to pregnant women and infants where this vaccine is contraindicated.' (said about US FluMist home use, 2024). source
No official or peer-reviewed source was found that says the spray caused the 2025-26 outbreak. No published critic was found who presents data showing that it did. (search done 22 Oct 2026)
What the cited sources show: the virus behind the outbreak was subclade K, which differs from the vaccine strain; vaccine virus turned up in 9 surveillance samples; the season began in teenagers and young adults as well as children; and subclade K drove early seasons in other countries too. None of these sources studied the question directly. (summary by this guide of the sources above)
What independent analysts have highlighted
Summaries of what each person says in the linked video (from the video captions). Wording is theirs or close to it; this guide has not checked their claims, and they are not official sources.
Campbell highlights that, on Our World in Data figures, excess deaths compared with 2015-2019 were still running at around 10% or more in 2022-2024 in the US, UK, Canada, Australia, the Netherlands, Ireland, Denmark, Germany, Japan (about 27% at the time) and other countries.
He highlights that Russia, Romania, Armenia, Georgia and Kazakhstan were below expected, which he links to these countries having had no mRNA vaccine roll-out ('coincidentally').
He cites Mostert et al. (BMJ Public Health 2024; retracted in August 2026, see below) for over 3 million excess deaths in 47 countries, and applies the Bradford Hill criteria to argue the correlation should be investigated.
He says OHID stopped publishing cause and age breakdowns. (OHID's stated reason: ONS and OHID adopted a similar method, so OHID paused its report.)
Campbell discusses a preprint (not peer-reviewed at the time, as he points out) from Western Norway University of Applied Sciences covering 31 European countries.
He highlights its finding that higher COVID-19 vaccine uptake in 2021 was associated with higher all-cause mortality in January-September 2022 (a 1 percentage point higher uptake went with about 0.105% higher monthly mortality), and that the authors say the link remained after controlling for other explanations.
He notes that the authors acknowledge the 'ecological fallacy': country-level patterns do not prove individual-level effects.
In an interview, Dr Joseph Fraiman describes his reanalysis of serious adverse events in the mRNA vaccine trials, and says excess deaths in 2022 across the Western world were not mainly COVID-19 because Omicron 'did not kill people in the way that the other ones did'.
Fraiman says excess deaths have many causes and are complex, and calls for them to be investigated.
Raszek summarises WHO estimates of about 15 million excess deaths worldwide in 2020-2021 (about 5 million in 2020 and 10 million in 2021), close to three times the reported COVID-19 deaths, with India having the largest number and Peru the highest relative excess.
He also cites a US study comparing COVID-19 death rates in the most and least vaccinated states, and describes a possible 'dilemma': vaccines saving lives in the short term while possibly 'making it more dangerous later on'.
Raszek reviews a paper analysing UK all-cause deaths by vaccination status (about 92% of the population, April 2021 to May 2023).
He highlights that people with one dose had roughly twice the all-cause death rate of unvaccinated people across age groups, while those with two or three doses at first had much lower rates (about 40% and 55% lower), followed by a later 'crossover' to higher rates.
He notes that the paper's authors think the strong early protection is unrealistic and may reflect bias in the data. He disagrees, suggests a possible non-specific immune effect, and calls for further study.
Suggested causes under investigation
Explanations named in official or peer-reviewed sources (and, for the COVID jab, by the analysts above), in no particular order. This guide does not rank them. Population ageing is not listed: the headline figures above already account for it.
COVID-19 infection and its after-effects (including long COVID)
Deaths with COVID-19 as the underlying cause: England and Wales 73,767 (2020), 67,369 (2021), 22,485 (2022), 11,847 (2023), 6,636 (2024), 3,095 (2025). source
US age-adjusted COVID-19 death rate per 100,000: 85.0 (2020), 104.1 (2021), 44.5 (2022), 11.9 (2023), 7.3 (2024). source
Peer-reviewed (US veterans): 'beyond the first 30 d after infection, individuals with COVID-19 are at increased risk of incident cardiovascular disease'. source
Peer-reviewed (24 countries): results 'suggest important indirect effects of the pandemic on non-COVID-19 mortality through the consequences of COVID-19 infection, nonpharmaceutical interventions, and underreporting of COVID-19-related deaths.' source
Delayed or missed care, including NHS waiting times
Peer-reviewed (England, 2016-18, before the pandemic): delays over 5 hours from arrival to admission 'are associated with an increase in all-cause 30-day mortality'; 'For every 82 admitted patients whose time to inpatient bed transfer is delayed beyond 6 to 8 hours... there is one extra death.' source
Peer-reviewed (England, 2021-22, ONS authors): 'Longer time spent in the ED for nonimmediate care is associated with increased risk of all-cause mortality within 30 days', but 'the reasons for this association are uncertain and may reflect residual confounding'. source
Cardiovascular disease and diabetes trends
Peer-reviewed (24 countries incl. England and Wales, US): 'Life expectancy losses due to cardiovascular disease (CVD) mortality were widespread during the pandemic'. source
US age-adjusted diabetes death rate per 100,000: 21.6 (2019), 24.8 (2020), 25.4 (2021), 24.1 (2022), 22.4 (2023), 21.7 (2024). Circulatory: 214.6 (2019), 233.3 (2021), 212.9 (2024). source
Influenza and other respiratory infections
OHID: in England in 2023, 'the underlying cause group resulting in the largest excess in 2023 was influenza and pneumonia'; for January 2023 peaks in circulatory, respiratory and dementia deaths, 'It is likely that the high levels of flu circulating contributed'. source
The COVID jab (mRNA vaccine)
Raised by the analysts listed above. Dr John Campbell points to timing ('after the vaccine roll out') and to countries with no mRNA roll-out having lower deaths than expected, and cites the Mostert et al. paper (below). source
Peer-reviewed paper often cited: Mostert et al., BMJ Public Health, May 2024 (excess deaths in 47 Western countries, 2020-2022). Its discussion named possible causes including COVID-19 vaccination. The journal retracted it on 11 Aug 2026 'for misinformation in the discussion regarding the possible causes of excess mortality, and because the limited nature of the original work by the authors was not sufficiently described'. Two authors agreed with the retraction but 'do not agree that the article contains misinformation'; Mostert 'disagrees with the decision to retract and the reasons for retraction'. sourcesource 2
Official data on the question (England, ONS, April 2021 to May 2023): age-standardised rate of deaths NOT involving COVID-19 in May 2023 was 901.6 per 100,000 person-years in unvaccinated people and 840.6 in ever-vaccinated people. ONS caution: 'the characteristics of people in the different vaccination status groups, such as health, may differ, particularly due to the prioritisation of the vaccine to more clinically vulnerable people.' source
CDC and US official bodies: no published assessment of the COVID jab as a cause of overall excess deaths was found in the sources checked. (search done 22 Oct 2026)
Ingredients of concern
Ingredients people often ask about. For each one: why it is used, which products in this guide list it, the amount per dose, what official bodies say about its safety, comparison exposures, regulatory history, and any cost reasons the sources give. Quotes are copied from the linked sources. This guide adds no opinion either way. "None found in the sources checked" means we looked and found nothing; it does not mean nothing exists.
Added as an adjuvant, 'a substance added to some vaccines to enhance the immune response'; forms used include aluminum hydroxide, aluminum phosphate, alum and mixed salts. source
Infanrix hexa 0.82 mg Al3+ (0.5 + 0.32 mg); Bexsero 0.5 mg; Gardasil 9 0.5 mg; Revaxis 0.35 mg; Repevax 0.33 mg; Penbraya 0.25 mg; Prevenar 13 / Prevnar 20 0.125 mg; Vaxneuvance 125 mcg (per dose, from each product's leaflet - see Ingredients table). (product leaflets linked in the Ingredients table) US legal limit per dose: 0.85 mg (by assay); 1.14 mg (by calculation); up to 1.25 mg if data show it is safe and necessary. source
Documented safety and toxicity facts
'Aluminum adjuvant containing vaccines have a demonstrated safety profile of over many decades of use and have only uncommonly been associated with severe local reactions.' source
Comparison exposures (diet, water, the body's own production)
'The most common source of exposure to aluminum is from eating food or drinking water.' source The average US adult 'eats about 7-9 mg aluminum per day in their food'; 'Children and adults may be exposed to small amounts of aluminum from vaccinations.' source
Regulatory history
US per-dose aluminium limit set in federal regulation (21 CFR 610.15). source
Preservative to prevent bacterial and fungal growth when needles repeatedly enter a multi-dose vial; also used in manufacture of some vaccines. source US regulation generally requires a preservative in multi-dose vials; FDA cites a 1928 Australian incident (Bundaberg) in which 12 children died after injection from a contaminated multi-dose bottle without preservative. source
0.01% thimerosal = 50 mcg thimerosal, about 25 mcg mercury per 0.5 mL dose. 2026-27 US labels: Fluzone multi-dose vial 25 mcg mercury per 0.5 mL; Flucelvax multi-dose vial 25 mcg. Single-dose syringes of these brands contain none. sourcesource 2 FDA table: Afluria multi-dose 24.5 mcg mercury per 0.5 mL. source
Documented safety and toxicity facts
Metabolised to ethylmercury and thiosalicylate; FDA says ethylmercury 'should be distinguished from methylmercury' (the type in fish), which 'at high exposure levels... can be toxic'. FDA's 1999 review 'found no evidence of harm... other than local hypersensitivity reactions'. source FDA 1999 review: depending on formulations and infant weight, 'some infants could have been exposed to cumulative levels of mercury during the first six months of life that exceeded Environmental Protection Agency (EPA) recommended guidelines for safe intake of methylmercury'. source WHO's advisory committee: 'no evidence to suggest that the amount of thiomersal used in vaccines poses a health risk'. source
Comparison exposures (diet, water, the body's own production)
FDA: 25 mcg mercury per 0.5 mL dose is 'roughly the same amount of elemental mercury contained in a 3 ounce can of tuna fish'. source
Regulatory history
US: 1 July 1999 FDA asked all manufacturers for plans to remove thimerosal, as 'a precautionary measure'. By 2001, except flu vaccines, it was 'removed from or reduced in all vaccines routinely recommended for children 6 years of age and under'. sourcesource 2 UK: Department of Health letter of 10 Aug 2004 - from 27 Sept 2004 new childhood vaccines (Pediacel, Repevax, Revaxis) were introduced; 'there is no thiomersal in the new vaccines'. source US: July 2025 the HHS Secretary adopted an ACIP recommendation that children, pregnant women and adults receive only single-dose, thimerosal-free flu vaccines. source The 2026-27 FDA labels for Fluzone and Flucelvax still describe a multi-dose vial containing thimerosal. sourcesource 2
Cost or commercial reasons given in the sources
WHO: 'Multi-dose vials are used in many countries because they require less storage space in the cold-chain and lead to less wastage, both of which have a significant impact on programme costs.' 'Alternatives would incur significant costs for development and regulatory approval, thereby limiting the ability to offer affordable vaccines.' source FDA: multi-dose vials 'help facilitate immunization campaigns in the United States and globally'. source
2026-27 flu labels: Fluzone up to 100 mcg per 0.5 mL; FluLaval up to 25 mcg; Fluarix up to 5 mcg. sourcesource 2
Documented safety and toxicity facts
'Excessive exposure to formaldehyde may cause cancer, but... the highest risk is from the air when formaldehyde is inhaled... There is no evidence linking cancer to infrequent exposure to tiny amounts of formaldehyde via injection as occurs with vaccines.' source
Comparison exposures (diet, water, the body's own production)
The body makes formaldehyde naturally; 'for a newborn of average weight of 6 - 8 pounds, the amount of formaldehyde in their body is 50-70 times higher than the upper amount that they could receive from a single dose of a vaccine or from vaccines administered over time'. source
Flucelvax up to 1,125 mcg; FluLaval up to 665 mcg; Fluarix up to 415 mcg per dose (2026-27 labels). Enflonsia 0.14 mg; Penbraya 0.018 mg. sourcesource 2 Infant vaccines: Prevnar 20 100 mcg per dose; Pediarix up to 100 mcg per dose. sourcesource 2
Documented safety and toxicity facts
Published LD50 (ChemIDplus/RTECS): intravenous rat 1,790 mg/kg; intravenous mouse 4,500 mg/kg; intraperitoneal rat 6,804 mg/kg; intraperitoneal mouse 7,600 mg/kg; oral mouse 25,000 mg/kg; oral rat 34.5 mL/kg. Lowest reported lethal dose (LDLo), intravenous dog and cat: 500 mg/kg. No intramuscular or subcutaneous LD50 found. source EFSA reports that 'The acute toxicity is very low' and that there is 'no concern regarding genotoxicity, carcinogenicity or developmental toxicity' (food-additive review). source Guide's own arithmetic Scaled to a 5 kg baby: intravenous rat LD50 = 8,950 mg; lowest lethal dose in dogs and cats (intravenous) = 2,500 mg. One infant dose of Prevnar 20 contains 0.1 mg: 89,500 times less than the rat figure (0.0011%) and 25,000 times less than the dog/cat figure (0.004%). The largest amount listed here, Flucelvax 1.125 mg (given from 6 months), is about 8,000 times less than the rat figure (0.013%) and about 2,200 times less than the dog/cat figure (0.045%). LD50 is the single dose that killed half of the test animals; it measures acute lethality only, not chronic, allergic or cumulative effects, and scaling an animal result to a baby by body weight is a simplification. Route matters: most vaccines are injected into muscle, so injected (intravenous, subcutaneous) values are more relevant than oral ones. sourcesource 2
Comparison exposures (diet, water, the body's own production)
EFSA (2015) keeps a group acceptable daily intake (ADI) of 25 mg per kg body weight per day for polysorbates in food (oral), based on a no-observed-adverse-effect level (NOAEL) of 2,500 mg/kg/day in rats. source Guide's own arithmetic For a 5 kg baby the ADI equals 125 mg a day by mouth; one 0.1 mg infant dose is 0.08% of one day's ADI, and 1.125 mg (Flucelvax) is 0.9%. The ADI is for food eaten every day, not for injection. source
Amount per dose not stated in the sources compiled.
Documented safety and toxicity facts
'History of hypersensitivity to yeast' is a contraindication to hep B vaccine. In 2011 the Institute of Medicine concluded 'the evidence convincingly supports a causal relationship between HepB vaccine and anaphylaxis in yeast-sensitive persons'. source
Comparison exposures (diet, water, the body's own production)
Amount per dose not stated in the sources compiled.
Documented safety and toxicity facts
FDA considers MSG in food 'generally recognized as safe' (GRAS); it has received reports of symptoms such as headache and nausea after eating foods containing MSG. source
Comparison exposures (diet, water, the body's own production)
'An average adult consumes approximately 13 grams of glutamate each day from the protein in food, while intake of added MSG is estimated at around 0.55 grams per day.' source
Priorix (US) neomycin up to 25 mcg per dose; Fluarix gentamicin up to 0.15 mcg. source
Documented safety and toxicity facts
'Antibiotics most likely to cause severe allergic reactions (e.g., penicillins, cephalosporins and sulfa drugs) are not used in vaccine production'; 'the very small amounts... have not been clearly associated with severe allergic reactions'. source
Comparison exposures (diet, water, the body's own production)
Residual cell-line DNA and protein (MRC-5, WI-38, Vero, MDCK, CHO)
Why it is used
Viruses for some vaccines are grown in cells: rubella in WI-38 human diploid lung fibroblasts; varicella passed through MRC-5 human diploid cells; polio (IPV) in monkey kidney (Vero) cells. sourcesource 2 WI-38 and MRC-5 are listed by the Coriell repository as diploid human fetal lung fibroblast cell strains (MRC-5 'from Britain'). source
Flucelvax (dog-kidney MDCK cells): up to 10 ng cell DNA and up to 21.6 mcg cell protein per dose (2026-27 label). Amounts for MRC-5/WI-38 vaccines not stated in sources compiled. source
Documented safety and toxicity facts
No LD50 published: residual cell DNA and protein are not tested for a lethal dose. (none found in ChemIDplus, PubChem or ECHA) WHO (2013) reports that its earlier recommendation 'sets the upper limit of rcDNA [residual cell DNA] at 10 ng per parenteral dose', and that DNA from primary cells and diploid cell lines (such as MRC-5 and WI-38) 'has not been (and is not) considered to pose any significant risk'; the theoretical concern is with continuous cell lines that grow indefinitely (such as Vero and MDCK). source Guide's own arithmetic Flucelvax's stated maximum, 10 ng of MDCK cell DNA per dose, equals the WHO upper limit of 10 ng. sourcesource 2
Comparison exposures (diet, water, the body's own production)
Less than 50 ng (0.00005 mg) residual glutaraldehyde per 0.5 mL dose in Daptacel and Pentacel (US labels); 50 ng or less in Vaxelis. sourcesource 2 Pentacel label: '<50 ng residual glutaraldehyde'. source
Documented safety and toxicity facts
Published LD50 (ChemIDplus/RTECS): intravenous rat 9.8 mg/kg; intravenous mouse 15.4 mg/kg; intraperitoneal rat 17.9 mg/kg; intraperitoneal mouse 13.9 mg/kg; subcutaneous rat more than 750 mg/kg; subcutaneous mouse more than 590 mg/kg; oral rat 134 mg/kg (PubChem/HSDB also lists 154-315 mg/kg in other rat studies). No intramuscular LD50 found. sourcesource 2 Guide's own arithmetic Scaled to a 5 kg baby: intravenous rat LD50 = 49 mg; subcutaneous rat = more than 3,750 mg; oral rat = 670 mg. One dose contains less than 0.00005 mg: at least 980,000 times less than the intravenous rat figure (about 0.0001% or less), and about 13 million times less than the oral figure. LD50 is the single dose that killed half of the test animals; it measures acute lethality only, not chronic, allergic or cumulative effects, and scaling an animal result to a baby by body weight is a simplification. Route matters: most vaccines are injected into muscle, so injected (intravenous, subcutaneous) values are more relevant than oral ones. sourcesource 2
Comparison exposures (diet, water, the body's own production)
Not an ingredient: some syringe tip caps or vial stoppers are made with natural rubber latex. Priorix (US): the diluent syringe tip caps 'contain natural rubber latex'. source
Pink Book: some hepatitis B and A vaccine presentations contain latex; a 2-valent HPV vaccine 'should not be used in persons with an anaphylactic allergy to latex'. sourcesource 2 FDA discourages 'latex-free' labelling because 'it is not possible to reliably assure that there is an absence of the allergens'. source
Comparison exposures (diet, water, the body's own production)
None found in the sources checked.
Regulatory history
FDA labelling guidance on latex statements issued December 2014. source
Amounts per dose not listed in the SmPC excipient section. source
Documented safety and toxicity facts
US, 14-23 Dec 2020: 21 anaphylaxis cases after 1,893,360 first doses of Pfizer-BioNTech (11.1 per million); 17 had a history of allergies; all 20 with follow-up recovered or were discharged. (The report does not attribute the reactions to a specific ingredient in the abstract.) source
Comparison exposures (diet, water, the body's own production)
None found in the sources checked.
Regulatory history
Formulation changed from phosphate-buffered saline to trometamol buffer (lipids unchanged) - see Ingredients table.
Other commonly flagged: fetal bovine serum, porcine circovirus DNA
Why it is used
Fetal bovine serum: when viruses are grown in cells, 'these cells need a source of nutrition, which in some instances may be provided by fetal bovine serum'. source Porcine circovirus: CDC's 2020 table notes PCV-1 is present in Rotarix and PCV-1/PCV-2 DNA in RotaTeq, 'not known to cause disease in humans'. source
mRNA vaccines give the body's cells a genetic message (messenger RNA) to make one protein from the germ, so the immune system learns to recognise it. Other vaccine types use a weakened live germ, a killed germ, a piece of the germ, or an inactivated toxin. vaccine types (HHS)
UK approved Jan 2026 (no US approval found) source
None of these mRNA products is on the routine childhood schedule in the UK. No viral-vector vaccine is among the products in this guide. (checked against the schedules in this guide, 22 Oct 2026)
mRNA and DNA: what the sources say
Official statements, independent studies and their stated limits, quoted from the linked sources. This guide takes no position.
The official position
CDC: 'COVID-19 vaccines do not change or interact with your DNA in any way... The genetic material delivered by mRNA vaccines never enters the nucleus of your cells, which is where your DNA is kept.' source
UK Green Book: 'mRNA is a natural component of the body, does not enter the nucleus and is processed entirely in the cytoplasm.' source
FDA (Dec 2023): 'it is quite implausible that the residual small DNA fragments located in the cytosol could find their way into the nucleus through the nuclear membrane present in intact cells and then be incorporated into chromosomal DNA.' FDA adds that animal studies and data from 'hundreds of millions of individuals' show no evidence of genotoxicity (damage to DNA). source
Leftover (residual) plasmid DNA and the SV40 fragment
How it gets there (FDA): the mRNA is made from a DNA template, which is then broken up with an enzyme (DNAse). The limit for leftover DNA fragments is 'less than three orders of magnitude lower than the quantity of the RNA dose by weight', checked by a validated qPCR test. source
McKernan et al. (2023, preprint, not peer-reviewed) tested 4 bivalent vials (2 Pfizer, 2 Moderna) and report 'DNA contamination that exceeds the European Medicines Agency (EMA) 330ng/mg requirement and the FDAs 10ng/dose requirements'. McKernan and Dr Phillip Buckhaults then publicly raised the SV40 promoter/enhancer sequence in Pfizer's plasmid (as Health Canada later noted). sourcesource 2
Speicher, Rose and McKernan (2025, peer-reviewed, 32 vials from 16 lots in Ontario): by fluorometry, total DNA was above the regulatory limit in all vials; by qPCR (the regulators' method) 'all Moderna vials were within the regulatory limit, but 2/6 Pfizer lots (3 vials) exceeded the regulatory limit for the SV40 promoter-enhancer-ori by 2-fold'. The SV40 sequence was found only in Pfizer vials. source
Kaiser et al. (2025, peer-reviewed, Frankfurt) tried to reproduce such claims with other methods and found DNA:RNA ratios of 1:1000, 'consistent with the specifications'. They say earlier high readings were 'a consequence of extraordinary high RNA and lipid concentrations' interfering with the test. source
Health Canada: 'Although the full DNA sequence of the Pfizer plasmid was provided at the time of initial filing, the sponsor did not specifically identify the SV40 sequence.' source
Health Canada: the vaccine contains no SV40 virus, only residual fragments of the SV40 promoter-enhancer, under 'strict quality limits'; 'Any claims that the presence of the SV40 promoter enhancer sequence is linked to an increased risk of cancer are unfounded.' source
FDA: 'No SV40 proteins are encoded for or are present in the vaccines.' FDA says the 2007 plasmid-DNA guidance some critics cite 'was developed for DNA vaccines themselves, not for DNA as a contaminant in other vaccines'. source
Limits of the evidence: the independent studies tested small numbers of vials (4 and 32). Speicher et al. argue that limits should consider 'increased LNP transfection efficiency' (DNA carried inside lipid nanoparticles gets into cells more easily) and 'cumulative dosing'. (summary by this guide of the sources above)
Aldén et al. 2022: reverse transcription in a lab dish
Swedish researchers exposed a human liver cancer cell line (Huh7) to the Pfizer vaccine in a lab dish. They report that 'BNT162b2 mRNA is reverse transcribed intracellularly into DNA in as fast as 6 h', with changes in LINE-1 (the body's own enzyme that can copy RNA into DNA). source
Limits the authors state: 'At this stage, we do not know if DNA reverse transcribed from BNT162b2 is integrated into the cell genome.' 'The cell model that we used in this study is a carcinoma cell line, with active DNA replication which differs from non-dividing somatic cells.' They call for further work 'both in vitro and in vivo', including 'tissues from human subjects who received BNT162b2'. A published comment (Merchant 2022) followed in the same journal. sourcesource 2
Has anyone shown integration into human DNA in vaccinated people?
One 2025 case report (one 31-year-old patient with bladder cancer, published in an Indian journal) claims 'the first documented evidence of genomic integration'. The evidence is a single 20-base sequence read in tumour DNA from the blood. The authors write that 'causality cannot be established from a single case' and call for 'orthogonal validation with long-read sequencing'. source
No study has independently confirmed vaccine DNA built into the DNA of vaccinated people. Apart from the single case report above, no peer-reviewed study was found claiming this. No regulator (FDA, MHRA, EMA, Health Canada) reports such a finding. (search done 22 Oct 2026)
Manufacturers' legal record
Court cases, regulator findings and official penalties involving the companies that make products in this guide. Vaccine-related cases are listed first and in full, with each outcome as the record shows it, including cases that were dismissed or are unproven. Large non-vaccine fines are summarised afterwards. Wording follows the official record: "misleading claims found by [body]" appears only where that body made such a finding. This guide adds no judgement.
Makers are as named in each product's official leaflet, linked in the ingredients table. (checked against the leaflets in this guide)
Johnson & Johnson/Janssen is included because its COVID-19 vaccine is part of the record below, although no J&J product is in the ingredients table. Valneva, Takeda and Bavarian Nordic make no product listed in this guide, so they are not covered. (note by this guide)
Gaps: the licence holder of Konakion MM (UK vitamin K) and of Kostaive (zapomeran) were not confirmed, so those companies' records are not covered. (note by this guide)
Vaccine-related cases and findings
Merck - Mumps part of MMR II / ProQuad: False Claims Act case (US ex rel. Krahling & Wlochowski v. Merck) Civil (whistleblower False Claims Act claim)Outcome: Dismissed: summary judgment for Merck (2023), upheld on appeal (2024). No payment.
Two former Merck employees claimed that Merck made false statements to the CDC about the mumps efficacy and potency of its MMR vaccine. source
Third Circuit, 6 Aug 2024: the District Court 'held that, even assuming the representations were false, none were material to the CDC's purchasing decision, and thus granted summary judgment in Merck's favor. We agree and will affirm.' source
The court found the CDC knew the facts about potency and shelf life, relied on its own real-world effectiveness studies, and kept buying the vaccine. source
Merck - Gardasil (HPV vaccine) injury lawsuits Civil (product liability)Outcome: Federal cases dismissed (2025); most remaining cases settled in 2026 for a reported ~$50 million, with no admission of liability.
11 Mar 2025, federal multi-district litigation (W.D. North Carolina): summary judgment for Merck in 16 bellwether cases alleging POTS or premature ovarian insufficiency. The judge ruled the failure-to-warn claims were preempted because Merck 'did not have sufficient newly acquired information' to change the label without FDA approval. source
4 Sep 2025, Fourth Circuit: affirmed the dismissal of three other cases because the plaintiffs had not filed on time in the federal Vaccine Injury Compensation Program first. It did not rule on the preemption decision. source
Jun 2026: Merck said it would settle all Gardasil cases except one. Bloomberg reported 'more than $50 million' for more than 200 cases, including the Los Angeles case (Robi v. Merck) set for trial. Merck is reported as not admitting liability and says evidence 'continues to support the safety and efficacy' of its HPV vaccines. No jury has decided a Gardasil case. source
GSK - Pandemrix (2009 swine flu vaccine) and narcolepsy Regulator finding + civil settlements (paid via state indemnity)Outcome: Link accepted by the EU regulator (2011); in Ireland, about 80 cases settled, funded under a state indemnity to GSK.
EMA, Jul 2011: recommended restricting Pandemrix in under-20s after Finnish and Swedish studies showed a 6- to 13-fold higher risk of narcolepsy in vaccinated children and adolescents. source
Ireland, Jul 2021: the High Court approved settlements of over EUR 4.5 million in three cases against the Minister for Health, the HSE and GSK. 'GSK was previously given an indemnity by the State concerning any adverse reactions to the vaccine.' The settlement terms covered 80 cases. source
Payouts in other countries (UK Vaccine Damage Payments, Sweden, Finland) were not totalled here. (gap)
Sanofi - Dengvaxia (dengue vaccine), Philippines Criminal charges (pending) + refundOutcome: Not proven: the criminal case against Sanofi Pasteur executives and others is still pending (pre-trial). Sanofi refunded unused doses and says the refund was not about safety.
Nov 2017: Sanofi reported that Dengvaxia could lead to more severe dengue in people never previously infected; the Philippines suspended the programme. Jan 2018: Sanofi agreed to refund unused doses worth about 1.4 billion pesos ($28 million), saying this was 'not related to any safety or quality issue'. The Philippine FDA also fined Sanofi a symbolic amount (about $2,000) over post-marketing surveillance, which Sanofi disputed. source
Jan 2025: the Philippine Department of Justice withdrew 98 reckless-imprudence homicide cases against the former health secretary and two other officials, saying a 'causal link' between vaccination and the deaths could not be established. source
28 Apr 2026: a Quezon City court denied the defence motions to dismiss 35 remaining cases, so they go to trial. The co-accused include 'top executives of vaccine maker Sanofi Pasteur Inc.' The judge said cause of death must be 'rigorously tested during a full-blown trial'. sourcesource 2
13 Oct 2026: in a separate graft case about the purchase (not involving Sanofi as a defendant), the anti-graft court acquitted the former health secretary and four other officials. source
AstraZeneca - COVID-19 vaccine (Vaxzevria): UK court claims and withdrawal Civil (UK Consumer Protection Act group claim; pending)Outcome: Not decided: AstraZeneca disputes the claims. In court papers it accepted the vaccine 'can, in very rare cases, cause TTS'. Authorisations were withdrawn in 2024 for stated commercial reasons.
Feb 2024: in a court document responding to a group claim by 51 claimants (12 bereaved), AstraZeneca stated its vaccine 'can, in very rare cases, cause TTS' (blood clots with low platelets), while disputing the claims. Source is the claimants' solicitors, quoting the document. source
27 Mar 2024: the EU marketing authorisation was withdrawn at AstraZeneca's request 'for commercial reasons'. source
May 2024: AstraZeneca said there was 'a surplus of available updated vaccines', leading to a 'decline in demand'; the vaccine was 'no longer being manufactured or supplied'. source
No court judgment has been found as of Oct 2026. (checked 22 Oct 2026)
Johnson & Johnson (Janssen) - COVID-19 vaccine: US restriction and end of authorisation Regulatory action (not a court case)Outcome: FDA restricted use in 2022 because of TTS risk; authorisation revoked in 2023 at Janssen's request.
5 May 2022: FDA limited the Janssen vaccine to adults who could not have, or would not accept, another COVID-19 vaccine, after its review of thrombosis with thrombocytopenia syndrome (TTS). source
1 Jun 2023: FDA revoked the emergency use authorisation at Janssen's request. FDA cited expired US stock, no demand for new lots, and no plan to update it for new variants. source
Pfizer - COVID-19 vaccine trial site: Brook Jackson v. Ventavia, Pfizer & ICON Civil (whistleblower False Claims Act claim)Outcome: Dismissed. The US government stepped in and asked for dismissal; the court agreed (Aug 2024). Appeal pending at the Fifth Circuit; no decision found.
The relator, Brook Jackson, brought False Claims Act claims about how Ventavia ran trial sites in Pfizer's COVID-19 vaccine trial. Mar 2023: the court dismissed her two substantive False Claims Act claims. source
9 Aug 2024: the court granted the United States' motion to intervene and dismiss, finding the government offered 'a reasonable explanation'. The claims were dismissed with prejudice as to the relator; her retaliation claim against Ventavia was also dismissed. No court made findings on the merits of the trial-conduct allegations. source
Appeal No. 24-40564 was still open, with the last filing on 21 Nov 2025; no decision found as of Oct 2026. source(checked 22 Oct 2026)
Pfizer - UK PMCPA rulings: promotion of its COVID-19 vaccine Industry code regulator rulings (not a court; no fines)Outcome: Misleading claims found by the PMCPA in three cases; Clause 2 ('bringing discredit upon... the pharmaceutical industry') breached in two.
AUTH/3591/12/21 (2022): about the Pfizer CEO's BBC interview (Dec 2021) on vaccinating 5-11-year-olds before UK approval. On appeal, the Appeal Board found the statements implied 'there was no need to be concerned about potential side-effects... which was not so', and found this 'misleading and incapable of substantiation'. It overturned the Clause 2 ruling. source
AUTH/3741/2/23 (completed Mar 2024): UK employees' re-tweets in Nov 2020 of the unlicensed vaccine's trial results. Breaches included promoting an unlicensed medicine, 'Making a misleading claim', claims not reflecting evidence on adverse reactions, and Clause 2. Pfizer acknowledged the Clause 2 breach. source
AUTH/3888/4/24 (completed Apr 2025): Pfizer UK's corporate tweets of Nov 2020. Breaches: promotion before authorisation, 'Making a misleading claim', failing to maintain high standards, Clause 2, and failing to comply with an undertaking. Some other alleged breaches were not upheld. source
Moderna - UK PMCPA ruling: Spikevax presentation Industry code regulator ruling (no fine)Outcome: Off-label promotion and Clause 2 breach found by the PMCPA (2024).
AUTH/3746/2/23 (completed Aug 2024): a Moderna-contracted UK speaker at an April 2022 congress presented data for a booster dose twice the licensed dose, with claims such as 'most immunogenic'. Rulings: breaches of Clause 11.2 (promotion inconsistent with the product licence), 5.1 and 2. No breach was found on promotion before authorisation or disguised promotion. The MHRA had earlier closed a complaint about the same event without upholding it. source
Wyeth (now Pfizer) - DTP vaccine: Bruesewitz v. Wyeth (US Supreme Court, 2011) Civil (product liability)Outcome: Ruled for Wyeth: the 1986 Act bars design-defect lawsuits against vaccine makers.
The parents of a child injured after a DTP dose sued Wyeth for defective design. The Supreme Court held that the National Childhood Vaccine Injury Act preempts such design-defect claims when the vaccine was properly made and carried proper warnings. source
Cutter Laboratories (historic; makes no product in this guide) - 1955 Cutter polio vaccine incident Civil (product liability)Outcome: Cutter found not negligent but liable without fault (breach of warranty).
CDC: some Cutter polio vaccine lots in 1955 contained live poliovirus; over 250 polio cases were attributed to them, many with paralysis. source
Gottsdanker v. Cutter Laboratories: the jury found Cutter not negligent, but liable for breach of implied warranty; this was upheld on appeal. source
US law: vaccine makers' liability and injury compensation
US National Childhood Vaccine Injury Act 1986: no vaccine maker is liable in a civil action 'if the injury or death resulted from side effects that were unavoidable even though the vaccine was properly prepared and was accompanied by proper directions and warnings'. source
Claims for covered vaccines must first go to the federal Vaccine Injury Compensation Program (VICP), not to court. source
The Supreme Court ruled in 2011 that this bars design-defect claims (Bruesewitz v. Wyeth, above). source
PREP Act: a declaration by the HHS Secretary gives makers and others immunity from liability for covered countermeasures, including COVID-19 vaccines, except for 'willful misconduct'. The only compensation route is the Countermeasures Injury Compensation Program (CICP). sourcesource 2
VICP payouts (HRSA data, as of the 1 Jan 2025 report): total outlays since 1988 of $5,323,056,559.90, including $4.78 billion paid to petitioners. Of 24,464 petitions adjudicated, 11,564 were compensated and 12,900 dismissed. source
HRSA: 'Approximately 60% of all compensation awarded by the VICP comes as result of a negotiated settlement... in which HHS has not concluded... that the alleged vaccine(s) caused the alleged injury.' HRSA's latest monthly report is dated 1 Oct 2026; its PDF could not be downloaded for this guide, so the Jan 2025 totals are shown. source
CICP, COVID-19 claims as of 1 Oct 2026: 14,250 filed (11,198 alleging vaccine injury), 8,369 decided, 120 found eligible and 66 compensated, with 8,249 denied. source
COVID-19 vaccine side effects: reassured, then confirmed (dated)
Only side effects that official bodies later confirmed are included. Each step is quoted from the linked source.
AstraZeneca (Vaxzevria) and blood clots with low platelets (TTS)
Reassurance 11 Mar 2021, EMA: 'There is currently no indication that vaccination has caused these conditions, which are not listed as side effects with this vaccine.' The number of clotting events in vaccinated people was 'no higher than the number seen in the general population'. source
Reassurance 11 Mar 2021, MHRA (quoted by BBC): no evidence the vaccine had caused the problems; 'Blood clots can occur naturally and are not uncommon.' source
Confirmed 7 Apr 2021, EMA: unusual blood clots with low platelets 'should be listed as very rare side effects'. The benefit-risk balance remained positive. source
Confirmed 7 Apr 2021, MHRA: evidence of a link 'is stronger'; overall risk about 4 per million doses. JCVI advised offering under-30s an alternative where available. sourcesource 2
Admitted in court Feb 2024, UK court document: AstraZeneca accepted the vaccine 'can, in very rare cases, cause TTS', while disputing the claims. source
Withdrawn Mar-May 2024: authorisations withdrawn. AstraZeneca's stated reason was 'a surplus of available updated vaccines' and declining demand; EMA records the reason as 'commercial reasons'. sourcesource 2
mRNA vaccines (Pfizer, Moderna) and myocarditis/pericarditis
Early reports Late Apr 2021: Israel's Health Ministry was examining heart-inflammation reports after the Pfizer vaccine, and the US military was reviewing 14 cases after mRNA vaccines. source
Reassurance 27 Apr 2021, CDC Director: 'We have not seen a signal and we've actually looked intentionally for the signal in the over 200 million doses we've given.' An FDA spokeswoman said FDA had not seen 'any safety signals for myocarditis'. sourcesource 2
Confirmed 23 Jun 2021, CDC advisers (ACIP): a 'likely association' of myocarditis with mRNA COVID-19 vaccines in adolescents and young adults, mostly males after dose 2. The benefits were still judged to outweigh the risks (published in MMWR 9 Jul 2021). source
Confirmed 25 Jun 2021, FDA: warnings of increased risk of myocarditis and pericarditis added to the Pfizer and Moderna fact sheets. source
Confirmed 9 Jul 2021, EMA: myocarditis and pericarditis 'can occur in very rare cases' after Comirnaty and Spikevax, to be listed as side effects. source
Which vaccines: the confirmations above name the two mRNA vaccines. For Vaxzevria (AstraZeneca) and the Janssen vaccine, EMA said 'no causal relationship with myocarditis or pericarditis could be established' at that time. source
Large non-vaccine fines and settlements (summary)
Totals per company, $100 million+ items only(calculated by this guide from the items below)
Company
Items
Total (nominal US$)
Pfizer
4
$4.01 billion
GSK
3
$4.24 billion
Merck
2
$1.6 billion
AstraZeneca
2
$875 million
Sanofi
2
$299 million
Johnson & Johnson
2
$7.2 billion
None of these fines or settlements was about a vaccine. (checked against each linked release)
The list covers fines and settlements of $100 million or more found in official DOJ releases (plus one Chinese court fine reported by Reuters, and one state attorneys-general settlement). It is not exhaustive. IRS tax settlements and private lawsuits (e.g. patent disputes) are excluded. Violation Tracker is a database for a fuller list. source
No fines or settlements of $100 million or more from official bodies were found for Moderna, BioNTech or CSL Seqirus. (searched 22 Oct 2026)
Totals add nominal US dollars from different years, not adjusted for inflation. J&J's opioid figure is a maximum payable over time. ((calculated by this guide))
Bextra and 3 other drugs: off-label promotion, kickbacks. Included a $1.195bn criminal fine, which DOJ called 'the largest criminal fine ever imposed in the United States for any matter'
Criminal + civil
Guilty plea (Pharmacia & Upjohn); civil part settled source
Pfizer
2013
$490.9 million
Wyeth: Rapamune off-label promotion
Criminal + civil
Guilty plea (misbranding); civil part settled source
Pfizer
2016
$784.6 million
Wyeth: Protonix Medicaid rebates
Civil
Settlement ('do not deny the government's allegations') source
GSK
2010
$750 million
SB Pharmco (Cidra, Puerto Rico): adulterated drugs
Ingredients other than the active part (the germ or toxin component). Taken from archived copies of official leaflets dated 2020 or earlier where one exists, with differences from today's version noted. Products with no archive from 2020 or earlier are marked. Vaccine type uses the HHS categories definitions; each product's type is as stated in its official leaflet linked in the right-hand column.
Product and vaccine type
Ingredients listed
Source and changes
Infanrix hexaCombination: toxoid + subunit (acellular pertussis) + inactivated (polio) + conjugate (Hib) + recombinant (hep B) vaccine · UK
archived copy (2020-11-17) · current Current text describes Medium 199 in more detail (now names phenylalanine, para-aminobenzoic acid, sodium, potassium). No ingredient added or removed.
VaxelisCombination: toxoid + subunit (acellular pertussis) + inactivated (polio) + conjugate (Hib) + recombinant (hep B) vaccine · UK and US
Rotarix (rotavirus, oral)Live attenuated (oral) vaccine · UK and US
2020 version: sucrose, dextran, sorbitol, amino acids, Dulbecco's Modified Eagle Medium; solvent calcium carbonate, xanthan gum, sterile water. US 2020 table adds: porcine circovirus type 1 (PCV-1) is present; 'not known to cause disease in humans'.
archived copy (2020-08-18) · US 2020 table · current Current EU formulation is different: sucrose, di-sodium adipate, DMEM (containing phenylalanine, sodium, glucose and other substances), sterile water. Dextran, sorbitol, calcium carbonate and xanthan gum no longer listed. The EU SmPC text extracted did not mention PCV-1; the US table does.
Prevenar 13 / Prevnar 13 (PCV13)Conjugate vaccine · UK (US until replaced by PCV15/PCV20)
Sodium chloride; succinic acid; polysorbate 80; water for injections. Carrier protein CRM197; adjuvant aluminium phosphate (0.125 mg Al).
Amino acids (incl. phenylalanine); lactose anhydrous; mannitol (E421); sorbitol (E420); Medium 199 (phenylalanine, para-aminobenzoic acid, sodium, potassium); solvent water for injections. Trace neomycin. Grown in chick embryo cells and MRC-5 cells.
no pre-2021 archive available (earliest archived UK SmPC: Wayback 2025-11-14)earliest archive · current Only current version available; UK licence is recent.
Sodium chloride; sodium acetate; water for injections. Tetanus toxoid carrier protein. US Nov 2021 table also lists formaldehyde.
archived copy (2020-12-20) · current No ingredient change (E-number added). Not in the Feb 2020 US CDC table (US licence April 2020); appears in Nov 2021 table.
Fluzone Trivalent 2026-27 (flu injection)Inactivated vaccine · US
Egg-grown, split virus. Sodium phosphate-buffered isotonic sodium chloride; formaldehyde (up to 100 mcg/0.5 mL); octylphenol ethoxylate (Triton X-100, up to 250 mcg). Thimerosal (25 mcg mercury/0.5 mL) in the multi-dose vial only. No antibiotics used.
Recombinant protein made in insect cells. Sodium chloride; sodium phosphates; polysorbate 20. Traces: baculovirus and insect-cell proteins and DNA, Triton X-100. No egg, antibiotics or preservative.
Vitamin K1 injection (phytonadione, Hospira) - NOT a vaccineNot a vaccine (vitamin) vitamin (not a vaccine) · US
Polyoxyethylated fatty acid derivative 70 mg/mL; dextrose hydrous 37.5 mg/mL; water for injection; benzyl alcohol 9 mg/mL (preservative); may contain HCl. (Other US brands/presentations differ; some are benzyl-alcohol-free.)
archived copy (2020-11-14) · current Current DailyMed label checked: same ingredients (polyoxyethylated fatty acid derivative, dextrose, water, benzyl alcohol, may contain HCl).
Vaxneuvance (PCV15)Conjugate vaccine · US (and UK licensed)
no pre-2021 archive available (earliest archived US label: DailyMed, Wayback 2022-06-20)earliest archive · current No ingredient change between the 2022 archive and the current label.
no pre-2021 archive available (earliest archived label: DailyMed, Wayback 2023-12-12)earliest archive · current No ingredient change between the 2023 archive and the current label.
Beyfortus (nirsevimab) - monoclonal antibody, not a vaccineNot a vaccine (monoclonal antibody) monoclonal antibody (not a vaccine) · US (UK not routine)
L-histidine; L-histidine hydrochloride; L-arginine hydrochloride; sucrose; polysorbate 80; water for injections.
no pre-2021 archive availableearliest archive · current Earliest archived EU SmPC: Wayback 2022-11-25.
Enflonsia (clesrovimab) - monoclonal antibody, not a vaccineNot a vaccine (monoclonal antibody) monoclonal antibody (not a vaccine) · US
Arginine hydrochloride; histidine; L-histidine monohydrochloride monohydrate; polysorbate 80; sucrose; water for injection. Antibody made in Chinese hamster ovary (CHO) cells. No preservative.
no pre-2021 archive available (earliest archived label: DailyMed, Wayback 2025-09-09)earliest archive · current No ingredient change between the 2025 archive and the current label.
Comirnaty (Pfizer-BioNTech COVID-19, mRNA)mRNA vaccine · US (UK: at-risk only)
Dec 2020 EU version: ALC-0315; ALC-0159; DSPC; cholesterol; potassium chloride; potassium dihydrogen phosphate; sodium chloride; disodium phosphate dihydrate; sucrose; water.
archived copy (2020-12-24) · current Current formulations replace the phosphate-buffered saline salts (potassium chloride, potassium dihydrogen phosphate, sodium chloride, disodium phosphate) with trometamol and trometamol hydrochloride. Lipids, sucrose and water unchanged. (Archive dated Dec 2020 exists because EU authorised it 21 Dec 2020.)
Spikevax (Moderna COVID-19, mRNA)mRNA vaccine · US (UK: at-risk only)
no pre-2021 archive availableearliest archive · current Earliest archived EU SmPC (as 'COVID-19 Vaccine Moderna'): Wayback 2021-01-22. Not compared line-by-line.
1 year: PCV; MenB; MMRV (ProQuad or Priorix-Tetra)
18 months (born on/after 1 July 2024): 6-in-1; MMRV
3 years 4 months: dTaP/IPV (REPEVAX) (+MMRV for some birth cohorts)
12-13 years: HPV (Gardasil 9)
14 years: Td/IPV (REVAXIS); MenACWY (MenQuadfi)
Yearly from age 2 (eligible ages): nasal flu (Fluenz)
Pregnancy: whooping cough and RSV (Abrysvo) vaccines
Selective: hep B at birth only if mother has hep B; BCG for higher-risk babies
Birth (not a vaccine): vitamin K offered (Konakion MM Paediatric)
From July 2025/Jan 2026: Hib/MenC removed; new 18-month appointment; MMR replaced by MMRV (chickenpox added). source
As of: July 2, 2025 schedule, restored after March 16 2026 court ruling (AAP v. Kennedy) source
Birth: Hep B dose 1; RSV antibody (nirsevimab or clesrovimab) if mother not vaccinated
1-2 months: Hep B dose 2
2, 4, 6 months: DTaP, Hib, PCV15/PCV20, IPV, Rotavirus (RotaTeq or Rotarix); Hep B dose 3 at 6-18 months
6 months+: Flu every year; COVID-19 (shared clinical decision-making)
12-15 months: MMR, chickenpox, Hib, PCV boosters; Hep A (2 doses, 12-23 months)
15-18 months: DTaP dose 4
4-6 years: DTaP, IPV, MMR, chickenpox boosters
11-12 years: Tdap, HPV, MenACWY (booster at 16)
16-23 years: MenB (shared decision)
Pregnancy: Tdap; RSV vaccine (Abrysvo) at 32-36 weeks in season
Birth (not a vaccine): vitamin K injection
Dec 2025 hep B birth-dose change and Jan 2026 schedule reductions were stayed by a federal court; the pre-change schedule is in force as of this writing. Legal status may change. source
How the schedule has changed
At a glance: born in which decade?
Disease doses: each disease a vaccine covers counts as one dose, so a 6-in-1 counts as 6, MMR as 3 and MMRV as 4. Injections are the number of shots. See Definitions.
Guide's own arithmetic, using disease doses (each disease covered counts as 1 dose), injections and diseases from the counts in the tables below. Each decade is represented by one schedule row: UK 1980s = 1983 (reconstruction), 1990s = 1992, 2000s = September 2006, 2010s = 2010, 2020s = January 2020; US 1980s = 1983, 1990s = 1994, 2000s = 2000, 2010s = 2010, 2020s = 2020. 'Born in 2026' = UK schedule from 1 September 2026; US January 2025 schedule (the court restored 'the version as of May 2025', which has the same doses apart from COVID-19). A child's actual schedule depended on the year of birth within the decade, because schedules changed during each decade. Flu and COVID-19 counts use the assumptions stated under 'How this guide counts'.
UK: born in each decade compared with a child born in 2026
Child born in 2026: Sept 2026 (now) schedule source: 48 disease doses (15 injections) for 14 diseases without flu or COVID-19; 62 disease doses (15 injections) for 15 diseases with them.
43 disease doses · 16 injections · 13 diseases vs 2026: 5 more disease doses; 1 fewer injection; 1 more disease
52 disease doses · 16 injections · 14 diseases vs 2026: 10 more disease doses; 1 fewer injection; 1 more disease
US: born in each decade compared with a child born in 2026
Child born in 2026: Jan 2025 schedule source: 50 disease doses (31 injections) for 15 diseases without flu or COVID-19; 88 disease doses (69 injections) for 17 diseases with them.
50 disease doses · 31 injections · 15 diseases vs 2026: no change in disease doses; no change in injections; no change in diseases
69 disease doses · 50 injections · 16 diseases vs 2026: 19 more disease doses; 19 more injections; 1 more disease
The full routine childhood schedule (birth to 18) at several points in time, in the UK and the US, taken from official schedules or archived copies. Each count below is this guide's own arithmetic from the linked schedule. Full schedules are in the expandable boxes further down.
How this guide counts
Diseases: each disease named on the schedule counts once. All meningococcal groups (B, C, ACWY) count as one disease, "meningococcal".
Disease doses (the headline count): each dose is counted once for each disease it covers. A 6-in-1 counts as 6, MMRV as 4, the pre-school 4-in-1 as 4, MMR, DTaP and the teenage 3-in-1 as 3, Hib/MenC as 2, and a single vaccine as 1. This is how the NVIC flyer reaches its totals (see below).
Injections (shots): doses given by needle. Oral polio, oral rotavirus and the UK nasal flu spray are not injections. Visits means the separate ages listed on that schedule. It does not include yearly flu visits.
Products given: each time a product is given counts as 1, so a combination counts once. Shown as a secondary column because some widely quoted figures use it.
Flu and COVID-19 are not in the main columns. They are shown separately, "with flu" and "with flu and COVID-19". US flu is assumed to be 19 doses: one each season from 6 months to 17 years (18 seasons), plus a second dose in the first season. US COVID-19 for January 2025 is assumed to be 19 doses: 2 in the first season (Moderna 2-dose start), then 1 a year. UK flu uses the eligible school years (9 seasons in 2019/20; 14 now). These are the guide's assumptions; the true number depends on birth date and product.
Where a vaccine was for one sex only (UK rubella in 1983 and 1992; HPV in 2010 in both countries), counts are for a girl.
Vaccines only for high-risk groups, or left to "shared clinical decision-making", are listed but not counted. The RSV antibody (nirsevimab) is not a vaccine and is not counted.
All counts in this section are the guide's own arithmetic, recalculated by the build script from the linked schedules.
UK 2000: no official schedule document was found online. 2006 is the nearest dated official schedule. UK 1983 is the guide's reconstruction (see its box below).
With combination vaccines, the January 2025 US schedule needs 21 injections instead of 31 (no flu or COVID). How: Vaxelis at 2, 4 and 6 months (replaces 11 single jabs with 3), Quadracel or Kinrix at 4-6 years (2 jabs to 1), ProQuad at 4-6 years (2 jabs to 1). CDC notes say MMR and varicella should be given separately for dose 1 at 12-47 months unless parents prefer MMRV, so ProQuad is not assumed at 12-15 months.source
In force now (22 Oct 2026): CRS reports that the court order of 16 March 2026 put the US schedule back to "the version as of May 2025" source. That version has the same doses as January 2025 except COVID-19. GAP: the guide could not machine-read the COVID-19 category on CDC's live page; check it there.source
US: disease doses over time
198324
198925
199434
200035
201050 (+19 flu)
202050 (+19 flu)
Jan 202550 (+19 flu, +19 COVID)
Jan 2026 (stayed)39 (+19 flu, +19 COVID)
routine disease doses yearly flu (assumed) COVID-19 (assumed). Bars show disease doses. Guide's own arithmetic.
Widely quoted figures: which counting method they match
NVIC's flyer reports "24 DOSES OF 7 VACCINES BY AGE 18" for 1983 and "69 DOSES OF 16 VACCINES BY AGE 18" for 2017 source. 1983: the disease-dose count gives 24 (DTP 5x3 + OPV 4 + MMR 1x3 + Td 1x2). 69: the disease-dose count with flu gives 69 for the 2010 and 2020 schedules (no 2017 schedule was checked).
A complaint hosted by Children's Health Defense reports a rise "from 11 doses targeting four diseases in 1983, to over 72 doses targeting 18 diseases" source; see also the '72-dose' article. 11 matches the products-given count for 1983. 'Four' matches the number of vaccines in 1983 (DTP, OPV, MMR, Td), not diseases: those vaccines cover 7. 72 matches the products-given count for January 2025 with flu and COVID-19 under this guide's assumptions (34 + 19 + 19). With the RSV antibody, that schedule covers 18 diseases. The complaint does not show its own tally, so the match may be a coincidence.
"12 in the 80s": matches the products-given count for the 1989 US schedule (DTP 5, OPV 4, MMR 1, Hib 1, Td 1 = 12).source
"70+ today": matches the products-given count with flu and COVID-19 for January 2025 (72), or the disease-dose count with flu (69). Without flu or COVID-19, the figures are 50 disease doses and 34 products given; with flu and COVID-19, 88 disease doses.
"30+ after the US cut": for the stayed January 2026 schedule, counting only vaccines for all children: 39 disease doses and 23 products given. So '30+' fits the disease-dose count, not the products-given count. HHS reports that the end-2024 schedule "recommended 17 immunizations for all children" source. CRS reports that 4 of the 19 vaccines on the 2025 schedule were high-risk or shared decision-making only, against 9 of 17 on the 2026 schedule source.
US changes in 2025-2026, as the official record shows them
May 2025 CDC's child schedule changed after the HHS Secretary's May 2025 COVID-19 directive; the 'version as of May 2025' is the one the court later restored. source
June 2025 The HHS Secretary terminated the appointments of all sitting ACIP members. source
2 July 2025 CDC's live child schedule page shows an addendum dated 2 July 2025. source
19 Sept 2025 ACIP recommended COVID-19 vaccination based on individual decision-making. source
5 Dec 2025 ACIP recommended individual-based decision-making for the hepatitis B birth dose for infants of mothers who test negative. source
5 Jan 2026 The Acting CDC Director adopted a revised schedule: 11 diseases for all children; HPV cut to 1 dose; rotavirus, flu, COVID-19, hepatitis A, hepatitis B, MenACWY, MenB, RSV antibody and dengue moved to high-risk and/or shared clinical decision-making. source
16 Mar 2026 The US District Court for Massachusetts (AAP v. Kennedy) stayed the 2026 schedule, reverting it to 'the version as of May 2025', and stayed 13 ACIP appointments and their votes. source
29 Apr 2026 The federal government appealed to the First Circuit. source
19 May 2026 HHS filed a notice to re-establish ACIP. source
29 May 2026 Executive Order 14407 called the 2026 assessment a 'guiding resource' and directed CDC and ACIP to review it. source
6 Oct 2026 First Circuit oral argument (news report). No ruling had been reported by 22 Oct 2026. source
GAP: No single official 1983 UK schedule was found online. This row is this guide's reconstruction: the 1968 schedule in Lang et al. Table 3 (smallpox removed - routine smallpox vaccination ended in 1971 - and girls' rubella added from the UKHSA timeline). MMR (1988) and the accelerated 2-3-4 month schedule (June 1990) came later.
Vaccine
Diseases
Doses
Ages
Given as
Notes
DTP
diphtheria, tetanus, pertussis
3
3 doses from 3-6 months, 6-8 weeks apart
injection
Oral polio
polio
3
with DTP
by mouth
Measles
measles
1
2nd year of life
injection
DT + oral polio booster
diphtheria, tetanus
1
school entry (about 5 years)
injection
Oral polio booster
polio
1
school entry
by mouth
Rubella (girls)
rubella
1
10-14 years
injection
Girls only (rubella programme from 1970, UKHSA timeline). Counts are for a girl.
The 2006 table plus HPV for girls (2008) and the switch from PCV7 to PCV13 (2010, UKHSA timeline). No routine children's flu programme until 2013 (UKHSA timeline).
Vaccine
Diseases
Doses
Ages
Given as
Notes
DTaP/IPV/Hib
diphtheria, tetanus, pertussis, polio, Hib
3
2, 3, 4 months
injection
PCV13 (PCV7 until 2010)
pneumococcal
3
2, 4, 13 months
injection
MenC
meningococcal
2
3, 4 months
injection
Hib/MenC
Hib, meningococcal
1
12 months
injection
MMR
measles, mumps, rubella
2
13 months; 3 years 4 months-5 years
injection
dTaP/IPV pre-school booster
diphtheria, tetanus, pertussis, polio
1
3 years 4 months-5 years
injection
Td/IPV teenage booster
diphtheria, tetanus, polio
1
13-18 years
injection
HPV (girls, Cervarix)
HPV
3
12-13 years, 3 doses within 12 months
injection
Girls only from September 2008 (CMO(2008)3). Counts are for a girl.
For a child born on or after 1 July 2024 (18-month visit) and on or after 1 January 2025 (no MMRV at 3 years 4 months). Hib/MenC at 1 year was removed from 1 January 2026; MMRV and the 18-month 6-in-1 dose were added (UKHSA change history).
Counted only in the 'with flu' / 'with flu and COVID' columns.
COVID-19
COVID-19
19 (assumed)
from 6 months; routine for all ages in the Jan 2025 edition
injection
Counted only in the 'with flu' / 'with flu and COVID' columns.
RSV monoclonal antibody (nirsevimab or clesrovimab): 1 dose under 8 months if the mother was not vaccinated - an antibody, not a vaccine; listed separately, not counted.
MenB at 16-18 years: shared clinical decision-making (not counted). Dengue: only for children with lab-confirmed past infection in endemic areas (not counted).
Status: Stayed by the US District Court for Massachusetts on 16 March 2026 (CRS R48982); not in force as of 22 Oct 2026.
Counts show the doses recommended for ALL children on this schedule. The doses moved to high-risk / shared decision-making are not counted in the main figures.
Vaccine
Diseases
Doses
Ages
Given as
Notes
DTaP
diphtheria, tetanus, pertussis
5
2, 4, 6, 15-18 months; 4-6 years
injection
Tdap
diphtheria, tetanus, pertussis
1
11-12 years
injection
IPV
polio
4
2, 4, 6-18 months; 4-6 years
injection
Hib
Hib
4
2, 4, 6, 12-15 months
injection
Dose timing not changed by the 2026 memo (CRS: 'mostly remain as they were').
PCV
pneumococcal
4
2, 4, 6, 12-15 months
injection
MMR
measles, mumps, rubella
2
12-15 months; 4-6 years
injection
Varicella
chickenpox
2
12-15 months; 4-6 years
injection
HPV
HPV
1
1 dose (was 2)
injection
Flu (yearly)
flu
19 (assumed)
moved to shared clinical decision-making
injection
Counted only in the 'with flu' / 'with flu and COVID' columns.
COVID-19
COVID-19
19 (assumed)
individual decision-making (ACIP, 19 Sept 2025)
injection
Counted only in the 'with flu' / 'with flu and COVID' columns.
Moved to high-risk groups and/or shared clinical decision-making: hepatitis B (for infants of mothers who test negative), hepatitis A, MenACWY, MenB, RSV antibody, dengue; rotavirus, flu and COVID-19 moved to shared clinical decision-making only (HHS fact sheet; CRS R48982).
For a child born on 22 October 2026, from the schedules in force. Each vaccine links to its ingredient entry in this guide; that entry links to the official leaflet.
Guide's own total at the routine visits: 48 disease doses and 15 injections (the disease doses include 2 rotavirus doses by mouth), plus about 14 yearly nasal flu sprays (14 more disease doses, no injections).
Babies at higher risk may also be offered hepatitis B at birth and 4 weeks, BCG, or injected flu (selective programmes on the same UKHSA schedule). Brand shown: the 6-in-1 may be Infanrix hexa or Vaxelis; MMRV may be ProQuad or Priorix Tetra.
Consent: the Scottish Government reports that "Vaccinations are not compulsory" source. The UKHSA Green Book reports that, to be valid, consent "must be given freely, voluntarily and without coercion" source.
US (CDC schedule as restored by the March 2026 court order)
Guide's own total at the routine visits listed: 51 disease doses and 32 injections (counting the RSV antibody, MenB and HPV dose 1 as listed; HPV dose 2 comes 6-12 months later), plus yearly flu and any COVID-19 doses. Combination vaccines cut the injections, not the disease doses; see the US counts above.
Hepatitis B doses 3 and IPV dose 3 may be given at any visit from 6 to 18 months; injection counts assume 6 months. COVID-19: the January 2025 edition recommended it for everyone from 6 months; ACIP moved it to individual decision-making on 19 Sept 2025 source, but the court stayed votes by the newly appointed ACIP members source. GAP: the category now shown for COVID-19 on CDC's live page was not verified by this guide. If the stayed January 2026 schedule takes effect, rotavirus, flu, COVID-19, hepatitis A, hepatitis B (mother negative), MenACWY and the RSV antibody move to high-risk and/or shared decision-making, and HPV becomes 1 dose source.
School exemptions by state: NCSL reports that all 50 states and DC require certain vaccines for school and all allow medical exemptions. 29 states and DC allow religious exemptions only; 16 states allow religious or personal-belief exemptions; Minnesota allows personal (conscientious) exemptions; 4 states (California, Connecticut, Maine, New York) allow no non-medical exemption source.
Religious exemption only (29 states + DC): Alabama, Alaska, Delaware, District of Columbia, Florida, Georgia, Hawaii, Illinois, Indiana, Iowa, Kansas, Kentucky, Maryland, Massachusetts, Mississippi, Missouri, Montana, Nebraska, Nevada, New Hampshire, New Jersey, New Mexico, North Carolina, Rhode Island, South Carolina, South Dakota, Tennessee, Vermont, Virginia, Wyoming. DC and Virginia also allow a personal exemption for HPV only.
Religious or personal-belief exemption (16): Arizona, Arkansas, Colorado, Idaho, Louisiana, Michigan, North Dakota, Ohio, Oklahoma, Oregon, Pennsylvania, Texas, Utah, Washington, West Virginia, Wisconsin. In Louisiana an exemption is by written dissent, with no reason in statute. In West Virginia exemptions are on hold while the state Supreme Court considers the case. Washington removed the personal-belief exemption for MMR in 2019.
Personal only: Minnesota (notarised statement). No non-medical exemption: California (removed 2015), Connecticut (2021), Maine (2019), New York (2019).
This section shows how many suspected vaccine reactions were reported for young children in the US each year, how many vaccine doses were on the schedule at the time, and how many injury claims were paid in the US and UK. A report is not proof that a vaccine caused the problem; see the box below.
Read this first: what these numbers can and cannot show
Anyone can report. The VAERS data guide reports that "A report to VAERS generally does not prove that the identified vaccine(s) caused the adverse event described. It only confirms that the reported event occurred sometime after vaccine was given." source
Under-reporting. The same guide reports that VAERS "receives reports for only a small fraction of actual adverse events" and that serious events soon after vaccination are "probably more likely to be reported" even if coincidental source. A 2010 Harvard Pilgrim report for the US Agency for Healthcare Research and Quality (AHRQ) states that "fewer than 1% of vaccine adverse events are reported" source. That line is background in the report; the project did not measure it.
Coincidence at this age. The guide reports that babies are vaccinated mostly at 2-6 months, when they are "at greatest risk" of fever, seizures and SIDS, so "Some infants will experience these medical events shortly after a vaccination by coincidence." source
Counting changes. Since May 2025 the public VAERS data also include "secondary reports" (an extra report from a new source about the same child, vaccine and dose); CDC says these "do not represent additional reports of adverse events" source. So 2025 is not directly comparable with earlier years.
Reports change over time. Counts are by the year the report was received, as of 25 September 2026, US and territories only. Reporting depends on awareness and publicity.
US: VAERS reports for babies under 1, per 100,000 births
199015.1 (25 disease doses)
199160.6 (25 disease doses)
199258.2 (25 disease doses)
199355.3 (25 disease doses)
199464.2 (34 disease doses)
199560.4 (34 disease doses)
199651.5 (34 disease doses)
199739.0 (34 disease doses)
199828.2 (34 disease doses)
199936.3 (34 disease doses)
200034.9 (35 disease doses)
200145.2 (35 disease doses)
200241.0 (35 disease doses)
200335.6 (35 disease doses)
200435.9 (35 disease doses)
200534.9 (35 disease doses)
200640.9 (35 disease doses)
200759.4 (35 disease doses)
200859.8 (35 disease doses)
200945.1 (35 disease doses)
201046.4 (50 disease doses)
201145.5 (50 disease doses)
201244.0 (50 disease doses)
201340.6 (50 disease doses)
201447.3 (50 disease doses)
201553.5 (50 disease doses)
201648.6 (50 disease doses)
201750.4 (50 disease doses)
201843.9 (50 disease doses)
201943.4 (50 disease doses)
202036.8 (50 disease doses)
202138.6 (50 disease doses)
202243.0 (50 disease doses)
202348.5 (50 disease doses)
202449.1 (50 disease doses)
Guide's own arithmetic: reports received in the year (any vaccine except COVID-19, babies under 1) divided by US births that year, times 100,000. Age 1-2 uses the births of the two previous years as an approximate denominator. Disease doses: the US schedule in force that year, from the 'How the schedule has changed' section (each disease a vaccine covers counts as one dose; flu and COVID-19 not counted). Reports: CDC WONDER VAERS. Births: births 1986-20052006-092010-202021-222023-24.
Year report received
US disease doses on the schedule (no flu/COVID)
Reports, babies under 1 (not COVID vaccine)
Per 100,000 births
Of which serious
Serious per 100,000 births
Death reports, under 1
Reports, age 1-2 (not COVID vaccine)
Age 1-2 per 100,000 children (approx.)
COVID-19 vaccine reports, age 0-2 (separate)
1990
25 (1989 schedule)
629
15.1
153
3.7
49
247
3.1
0
1995
34 (1994 schedule)
2,355
60.4
468
12.0
97
1,552
19.5
0
2000
35 (2000 schedule)
1,418
34.9
322
7.9
81
2,767
35.0
0
2005
35 (2000 schedule)
1,445
34.9
310
7.5
68
2,729
33.3
0
2010
50 (2010 schedule)
1,856
46.4
319
8.0
47
2,834
33.8
0
2015
50 (2010 schedule)
2,127
53.5
257
6.5
39
2,412
30.5
0
2019
50 (2010 schedule)
1,626
43.4
260
6.9
33
2,106
27.5
0
2020
50 (2020 schedule)
1,331
36.8
152
4.2
30
1,558
20.7
5
2021
50 (2020 schedule)
1,416
38.6
131
3.6
23
1,583
21.5
261
2022
50 (2020 schedule)
1,577
43.0
89
2.4
17
1,781
24.5
1,383
2023
50 (2020 schedule)
1,743
48.5
119
3.3
20
2,101
28.7
1,929
2024
50 (2020 schedule)
1,782
49.1
131
3.6
27
2,032
28.0
530
2025
50 (2025 schedule)
1,557
n/a
162
n/a
16
1,775
24.6
204
Every year, 1990-2025
Year report received
US disease doses on the schedule (no flu/COVID)
Reports, babies under 1 (not COVID vaccine)
Per 100,000 births
Of which serious
Serious per 100,000 births
Death reports, under 1
Reports, age 1-2 (not COVID vaccine)
Age 1-2 per 100,000 children (approx.)
COVID-19 vaccine reports, age 0-2 (separate)
1990
25 (1989 schedule)
629
15.1
153
3.7
49
247
3.1
0
1991
25 (1989 schedule)
2,492
60.6
510
12.4
118
1,685
20.6
0
1992
25 (1989 schedule)
2,364
58.2
484
11.9
134
1,512
18.3
0
1993
25 (1989 schedule)
2,211
55.3
491
12.3
155
1,291
15.8
0
1994
34 (1994 schedule)
2,539
64.2
576
14.6
156
1,334
16.5
0
1995
34 (1994 schedule)
2,355
60.4
468
12.0
97
1,552
19.5
0
1996
34 (1994 schedule)
2,004
51.5
375
9.6
78
1,630
20.8
0
1997
34 (1994 schedule)
1,513
39.0
319
8.2
81
1,840
23.6
0
1998
34 (1994 schedule)
1,111
28.2
259
6.6
77
1,667
21.4
0
1999
34 (1994 schedule)
1,437
36.3
472
11.9
82
2,251
28.8
0
2000
35 (2000 schedule)
1,418
34.9
322
7.9
81
2,767
35.0
0
2001
35 (2000 schedule)
1,821
45.2
400
9.9
99
3,140
39.2
0
2002
35 (2000 schedule)
1,648
41.0
371
9.2
79
2,937
36.3
0
2003
35 (2000 schedule)
1,457
35.6
342
8.4
82
2,727
33.9
0
2004
35 (2000 schedule)
1,475
35.9
320
7.8
84
2,526
31.1
0
2005
35 (2000 schedule)
1,445
34.9
310
7.5
68
2,729
33.3
0
2006
35 (2000 schedule)
1,746
40.9
322
7.5
66
3,029
36.7
0
2007
35 (2000 schedule)
2,565
59.4
650
15.1
82
2,789
33.2
0
2008
35 (2000 schedule)
2,541
59.8
621
14.6
85
2,654
30.9
0
2009
35 (2000 schedule)
1,862
45.1
383
9.3
53
2,847
33.2
0
2010
50 (2010 schedule)
1,856
46.4
319
8.0
47
2,834
33.8
0
2011
50 (2010 schedule)
1,799
45.5
393
9.9
58
2,112
26.0
0
2012
50 (2010 schedule)
1,740
44.0
318
8.0
54
1,732
21.8
0
2013
50 (2010 schedule)
1,595
40.6
269
6.8
34
1,899
24.0
0
2014
50 (2010 schedule)
1,885
47.3
290
7.3
28
2,128
27.0
0
2015
50 (2010 schedule)
2,127
53.5
257
6.5
39
2,412
30.5
0
2016
50 (2010 schedule)
1,919
48.6
286
7.2
44
1,982
24.9
0
2017
50 (2010 schedule)
1,942
50.4
274
7.1
52
2,485
31.4
0
2018
50 (2010 schedule)
1,666
43.9
218
5.7
34
2,087
26.8
0
2019
50 (2010 schedule)
1,626
43.4
260
6.9
33
2,106
27.5
0
2020
50 (2020 schedule)
1,331
36.8
152
4.2
30
1,558
20.7
5
2021
50 (2020 schedule)
1,416
38.6
131
3.6
23
1,583
21.5
261
2022
50 (2020 schedule)
1,577
43.0
89
2.4
17
1,781
24.5
1,383
2023
50 (2020 schedule)
1,743
48.5
119
3.3
20
2,101
28.7
1,929
2024
50 (2020 schedule)
1,782
49.1
131
3.6
27
2,032
28.0
530
2025
50 (2025 schedule)
1,557
n/a
162
n/a
16
1,775
24.6
204
COVID-19 vaccine reports for children 0-2 are shown in their own column and are not in the other figures. 2025 births had not been published as final when this was checked, so 2025 rates for babies under 1 are not calculated.
VAERS 1991-2001 as published by CDC at the time (MMWR 2003)
CDC's 2003 surveillance summary reports these VAERS counts source. The current CDC WONDER count for the same year is shown for comparison; differences come from later updates to the data.
Year
Reports, under 1 (MMWR 2003)
Reports, under 1 (CDC WONDER today, not COVID vaccine)
Reports, age 1-6 (MMWR 2003)
All reports, all ages (MMWR 2003)
1991
2,543
2,492
2,531
10,004
1992
2,426
2,364
2,378
10,821
1993
2,296
2,211
2,154
10,327
1994
2,616
2,539
2,208
10,355
1995
2,439
2,355
2,484
10,301
1996
2,159
2,004
2,832
11,238
1997
1,732
1,513
3,294
11,711
1998
1,356
1,111
2,891
10,898
1999
1,743
1,437
3,557
13,157
2000
1,725
1,418
4,466
15,153
2001
2,260
1,821
5,620
14,752
US: Vaccine Injury Compensation Program (VICP)
HRSA reports that since 1988 "over 30,322 petitions have been filed", 26,871 have been decided, "13,464 of those determined to be compensable, while 13,407 were dismissed", and about $5.6 billion has been paid source. HRSA also reports that "Approximately 60 percent of all compensation awarded by the VICP comes as result of a negotiated settlement" in which HHS has not concluded that the vaccine caused the injury, and that from 2006 to 2024, "for every 1 million doses of vaccine that were distributed, approximately 1 individual was compensated" source.
Fiscal year
Petitions filed
Found compensable
Dismissed
Paid to petitioners
FY 1990
1,492
97
43
$53.25 million
FY 1995
180
171
542
$104.09 million
FY 2000
163
125
106
$125.95 million
FY 2005
735
56
235
$55.07 million
FY 2010
447
180
321
$179.39 million
FY 2015
803
523
150
$204.14 million
FY 2020
1,192
718
232
$186.86 million
FY 2024
1,185
1,132
307
$149.65 million
FY 2025
1,300
1,048
271
$142.87 million
FY 2026
1,192
976
191
$148.28 million
All ages. Source: HRSA VICP monthly statistics, 1 Oct 2026. FY 2026 is the fiscal year to 30 Sept 2026. GAP: HRSA does not publish VICP claims split by child or adult.
UK: Vaccine Damage Payment Scheme (VDPS)
The VDPS pays a one-off £120,000 (not compensation) if, on the balance of probabilities, a vaccine caused severe disablement (at least 60%) source.
Since COVID-19 vaccines: NHSBSA reports that from 26 August 2021 to 19 September 2024 it received 16,030 claims (all vaccines, all ages); 192 claimants were told they were entitled to a payment; 7,265 were refused because the assessor found the vaccine did not cause the disability; 386 because the disablement was not severe; 710 did not meet the criteria for assessment; 7,127 had no outcome yet source.
Gaps: the UK Yellow Card scheme does not publish reports by child age or outcome in a form this guide could use, so there is no UK equivalent of the VAERS table. VDPS figures are not split by child or adult and older figures are not linked to a named vaccine. VICP has no child/adult split.
Benefit vs risk per vaccine
For each routine vaccine: how common and how deadly the disease was before the vaccine and is now, next to the confirmed serious reactions and deaths from the vaccine. Open a row to see the figures and sources. The guide does not net one against the other; the numbers come from different sources and populations.
How to read it. "1 in X" and "%" are two ways of writing the same chance. "Crude, whole population" means recent cases divided by everyone in the country, vaccinated or not; it is not the chance for an unvaccinated child, which would be higher and is not published. "Confirmed" means an official review or a peer-reviewed study found the vaccine caused it. The greyed column counts reports only.
Guide's own arithmetic: recent-year rates per 100,000 people and '1 in X' are case counts divided by population (England mid-2025, England and Wales mid-2024, US 1 July 2024), rounded. Percentages next to reaction rates are the guide's conversion of the source's '1 in X'. Each 'Bottom line' converts the counts and rates in that block into a percentage and an 'about 1 in X' (count divided by population for 'everyone in the country' figures); 'not published' means no figure was found in the sources checked. Population: EnglandEngland and WalesUS. Case counts: disease sections of this guide.
MMR (measles, mumps, rubella) UK and US
The disease
Measles
Chance of catching it (per year)
0.0016%
UK about 1 in 61,400
0.00067%
US about 1 in 149,000
US: 0.00067% (about 1 in 149,000)
Chance of dying if you catch it
0.1–0.3%
about 1 in 1,000 to 1 in 333
Mumps
Chance of catching it (per year)
0.00026%
UK about 1 in 387,000
0.000099%
US about 1 in 1.01 million
US: 0.000099% (about 1 in 1.01 million)
Chance of dying if you catch it
–
not published
Rubella
Chance of catching it (per year)
0
no cases
Chance of dying if you catch it
–
not published
The vaccine
Fit with fever
0.025–0.033%
about 1 in 4,000 to 1 in 3,000
Severe allergic reaction
0.00013%
about 1 in 763,000
Different bases: disease figures are per person per year across everyone; vaccine figures are per dose or per vaccinated child. Details and sources below.
Full figures and sources
The numbers above in full with years, bases and sources; guide's own conversion into % and "1 in X"
MeaslesCatching it(chance per person in one recent year, whole population vaccinated or not, unless stated): England 2025: 0.0016%(about 1 in 61,400)source; US 2025: 0.00067%(about 1 in 149,000)source|Dying from it(same basis unless stated): England & Wales 2025: 0.0000049%(about 1 in 20.6 million)source; US 2025: 0.00000088%(about 1 in 113 million)source|Dying if caught: US: 0.1% to 0.3%(about 1 in 1,000 to 1 in 333)source
MumpsCatching it(chance per person in one recent year, whole population vaccinated or not, unless stated): England 2024: 0.00026%(about 1 in 387,000)source; US 2025: 0.000099%(about 1 in 1.01 million)source|Dying from it(same basis unless stated): UK and US: not published|Dying if caught: not published (deaths 'very rare')source
RubellaCatching it(chance per person in one recent year, whole population vaccinated or not, unless stated): England 2024: 0source; US 2025: 0source|Dying from it(same basis unless stated): UK and US: 0 (no cases)|Dying if caught: not published (main harm is to unborn babies)source
vs the vaccine Febrile seizure (fit with fever) 6-14 days after, per vaccinated child: 0.025% to 0.033%(about 1 in 4,000 to 1 in 3,000)source; Low platelets (ITP), per vaccinated child: 0.0025%(about 1 in 40,000)source; Anaphylaxis (severe allergic reaction), per dose, all vaccines: 0.00013%(about 1 in 763,000)source
Not the same units: disease figures are the chance per person in one year across the whole population (vaccinated or not); the chance for an unvaccinated child is higher and is not published. Vaccine figures are per dose or per vaccinated child.
All known reactions
Common and rare reactions listed in official product information, WHO reaction-rate sheets, CDC pages and key studies. Chances are per dose unless stated. Percentages and "about 1 in X" are the guide's own conversion. Product-information bands are ranges (very common: 1 in 10 or more; common: 1 in 100 to 1 in 10; uncommon: 1 in 1,000 to 1 in 100; rare: 1 in 10,000 to 1 in 1,000; very rare: fewer than 1 in 10,000). Many raw rates come from trials without a placebo group, so some of these events would have happened anyway.
Raw rate seen after vaccination; includes events that would have happened anyway
Aseptic meningitis (Jeryl Lynn-type mumps strain used in UK/US) Other mumps strains not used in the UK/US: Urabe 90-490, Leningrad-Zagreb up to 900 per million.
Measles vaccine-virus brain infection in people with very weak immune systems IOM 2011: evidence 'convincingly supports' a causal link in immunodeficient people. This is why the jab isn't given to them.
Measles: pre-vaccine vs 2025 US 20th-century annual average: 530,217 reported cases (estimated true 3-4 million/yr) vs 1,975 reported in 2025. source
Measles: pre-vaccine England & Wales 1940-1967 (before vaccine, 1968): typically 160,000-760,000 notifications and 30-1,100 deaths a year; e.g. 1967: 460,407 notifications, 99 deaths. source
Mumps: pre-vaccine vs 2025 US 20th-century annual average 162,344 cases vs 336 in 2025 (>99% decrease). source
Rubella (German measles): pre-vaccine vs 2025 US 20th-century annual average 47,745 rubella cases and 152 CRS cases vs 0 and 1 in 2025. source
Chance of catching it: recent year (crude, whole population)
Measles
England 2025, lab-confirmed: 958 cases; 1.63 per 100,000 people (1 in 61,400)
US 2025, confirmed: 2,289 cases; 0.67 per 100,000 people (1 in 148,600)
Mumps
England 2024, lab-confirmed: 152 cases; 0.26 per 100,000 people (1 in 387,100)
US 2025, reported: 336 cases; 0.10 per 100,000 people (1 in 1,012,200)
Rubella (German measles)
England 2024: 0 cases; 0 per 100,000 people (none)
US 2025: 0 cases; 0 per 100,000 people (none)
Chance of death if caught
Measles: 1 to 3 of every 1,000 children with measles die (US). source
Mumps: 'Permanent sequelae and death are very rare in both vaccinated and unvaccinated patients.' (no numeric CFR given) source
Rubella (German measles): Main harm is congenital rubella syndrome (deafness, eye defects, heart disease); risk highest in first 12 weeks of pregnancy. No CFR given. source
Confirmed serious reactions
Febrile seizure (fit with fever) 6-14 days after: 1 in 3,000 to 1 in 4,000 children (0.025% to 0.033%) source
Low platelets (ITP) within 6 weeks: 1 in 40,000 vaccinated children (one study) (0.0025%) source
Anaphylaxis (any vaccine): about 1 in 763,000 doses (0.00013%) source
Confirmed deaths caused by the vaccine
No official per-dose death rate. IOM 2011 found 'convincing' evidence that measles vaccine virus can cause brain infection (MIBE) in children with severe immune deficiency; no population rate given. source
Reported deaths within about 72 hours (unverified)
This vaccine: 59 of 181 VAERS death reports (age 0-2) had onset within about 72 hours
Recognised in children: none with an official rate.
Disputed claims and what reviews found
Autism: IOM 2011: evidence 'favors rejection' of a causal link with MMR. source
Autism (current CDC wording): CDC's page now says 'vaccines do not cause autism' is 'not an evidence-based claim' because studies have not ruled it out. source
Type 1 diabetes: IOM 2011: evidence 'favors rejection'. source
Chickenpox (varicella; MMRV) US; UK as MMRV on the 2026 schedule
The disease: Chickenpox
Chance of catching it (per year)
–
UK not published
0.01%
US about 1 in 9,930
US: 0.01% (about 1 in 9,930)
Chance of dying if you catch it
0.001%
about 1 in 100,000
The vaccine
Fit with fever
0.04–0.08%
about 1 in 2,500 to 1 in 1,250
Severe allergic reaction
0.00013%
about 1 in 763,000
Different bases: disease figures are per person per year across everyone; vaccine figures are per dose or per vaccinated child. Details and sources below.
Full figures and sources
The numbers above in full with years, bases and sources; guide's own conversion into % and "1 in X"
ChickenpoxCatching it(chance per person in one recent year, whole population vaccinated or not, unless stated): England: not published (not a notifiable disease)source; US 2022: 0.01%(about 1 in 9,930)source|Dying from it(same basis unless stated): England: not published for a recent year (an earlier analysis estimated 18.5 deaths a year, 2004-2013)source; US: not published|Dying if caught: children 1-14, pre-vaccine US data: 0.001%(about 1 in 100,000)source
vs the vaccine Febrile seizure after the first dose at 12-23 months, separate MMR + chickenpox jabs, per child: 0.04%(about 1 in 2,500)source; Same, MMRV combined jab (CDC: twice as likely; guide's arithmetic): 0.08%(about 1 in 1,250)source; Anaphylaxis (severe allergic reaction), per dose, all vaccines: 0.00013%(about 1 in 763,000)source
Not the same units: disease figures are the chance per person in one year across the whole population (vaccinated or not); the chance for an unvaccinated child is higher and is not published. Vaccine figures are per dose or per vaccinated child.
All known reactions
Common and rare reactions listed in official product information, WHO reaction-rate sheets, CDC pages and key studies. Chances are per dose unless stated. Percentages and "about 1 in X" are the guide's own conversion. Product-information bands are ranges (very common: 1 in 10 or more; common: 1 in 100 to 1 in 10; uncommon: 1 in 1,000 to 1 in 100; rare: 1 in 10,000 to 1 in 1,000; very rare: fewer than 1 in 10,000). Many raw rates come from trials without a placebo group, so some of these events would have happened anyway.
Raw rate seen after vaccination; includes events that would have happened anyway
Extra over background extra cases compared with unvaccinated people or other periods
Product-info band official frequency band; not a precise rate
No rate cause accepted but no rate published
Reaction
Chance
About
Type of figure
Source
Sore, red or swollen arm within 3 days, dose 1 Dose 2: about 1 in 4.
Extra fits with fever from the combined MMRV jab compared with separate jabs (days 5-12, first dose) 0.70 vs 0.32 per 1,000 children. No increase over 30 days.
Vaccine-virus infection spreading through the body in people with very weak immune systems IOM 2011: evidence 'convincingly supports' a causal link in immunodeficient people.
Chickenpox (varicella): pre-vaccine vs 2022 US pre-vaccine estimate 4,085,120 cases/yr vs 34,238 (2022): 99% decrease; ~10,500 hospitalisations/yr pre-vaccine. source
Chance of catching it: recent year (crude, whole population)
Chickenpox (varicella)
England: not notifiable, no case count
US 2022, provisional: 34,238 cases; 10.1 per 100,000 people (1 in 9,934)
Chance of death if caught
Chickenpox (varicella): About 1 per 100,000 cases in children 1-14; 6 per 100,000 aged 15-19; 21 per 100,000 in adults (pre-vaccine US data). Newborns whose mother has chickenpox around delivery: up to 30% if antivirals not given. source
Confirmed serious reactions
Febrile seizure, first dose at 12-23 months: separate MMR + varicella: about 1 in 2,500; MMRV: CDC says twice as likely (0.04% (separate); about 0.08% for MMRV, this guide's arithmetic) source
Anaphylaxis (any vaccine): about 1 in 763,000 doses (0.00013%) source
Confirmed deaths caused by the vaccine
No official per-dose death rate. IOM 2011: 'convincing' evidence that vaccine-strain virus can spread through the body in children with immune deficiency; no population rate given. source
Reported deaths within about 72 hours (unverified)
This vaccine: 45 of 136 VAERS death reports (age 0-2) had onset within about 72 hours
Diphtheria, tetanus, whooping cough (in the 6-in-1 / DTaP) UK and US
The disease
Whooping cough
Chance of catching it (per year)
0.025%
UK about 1 in 3,950
0.0083%
US about 1 in 12,100
US: 0.0083% (about 1 in 12,100)
Chance of dying if you catch it
–
not published
Tetanus
Chance of catching it (per year)
0.00001%
UK about 1 in 9.81 million
0.000011%
US about 1 in 9.19 million
US: 0.000011% (about 1 in 9.19 million)
Chance of dying if you catch it
11%
about 1 in 9
Diphtheria
Chance of catching it (per year)
0.0000034%
UK about 1 in 29.4 million
0
US no cases
US: 0 (no cases)
Chance of dying if you catch it
5–10%
about 1 in 20 to 1 in 10
The vaccine
Floppy, unresponsive episode
0.014–0.062%
about 1 in 7,140 to 1 in 1,610
Severe allergic reaction
0.00013%
about 1 in 763,000
Different bases: disease figures are per person per year across everyone; vaccine figures are per dose or per vaccinated child. Details and sources below.
Full figures and sources
The numbers above in full with years, bases and sources; guide's own conversion into % and "1 in X"
Whooping coughCatching it(chance per person in one recent year, whole population vaccinated or not, unless stated): England 2024: 0.025%(about 1 in 3,950)source; US 2025: 0.0083%(about 1 in 12,100)source|Dying from it(same basis unless stated): England 2024 (11 infant deaths): 0.000019%(about 1 in 5.35 million)source; US 2024: 0.0000029%(about 1 in 34 million)source|Dying if caught: no single rate publishedsource
TetanusCatching it(chance per person in one recent year, whole population vaccinated or not, unless stated): England 2024: 0.00001%(about 1 in 9.81 million)source; US 2025: 0.000011%(about 1 in 9.19 million)source|Dying from it(same basis unless stated): England 2024: 0.0000034%(about 1 in 29.4 million)source; US: not published|Dying if caught: recent US cases: 11%(about 1 in 9)source
DiphtheriaCatching it(chance per person in one recent year, whole population vaccinated or not, unless stated): England 2024: 0.0000034%(about 1 in 29.4 million)source; US 2025: 0source|Dying from it(same basis unless stated): England 2024: 0source; US 2025: 0 (no cases)source|Dying if caught: overall: 5% to 10%(about 1 in 20 to 1 in 10)source
vs the vaccine Seizures or brain problems after DTaP: no increased risk found in studiessource; Anaphylaxis (severe allergic reaction), per dose, all vaccines: 0.00013%(about 1 in 763,000)source; Old whole-cell DTP (no longer used): acute brain inflammation, per dose: 0% to 0.0011%(up to about 1 in 95,200)source; Floppy, unresponsive episode (HHE) after the acellular jab, per dose (child recovers): 0.014% to 0.062%(about 1 in 7,140 to 1 in 1,610)source
Not the same units: disease figures are the chance per person in one year across the whole population (vaccinated or not); the chance for an unvaccinated child is higher and is not published. Vaccine figures are per dose or per vaccinated child.
All known reactions
Common and rare reactions listed in official product information, WHO reaction-rate sheets, CDC pages and key studies. Chances are per dose unless stated. Percentages and "about 1 in X" are the guide's own conversion. Product-information bands are ranges (very common: 1 in 10 or more; common: 1 in 100 to 1 in 10; uncommon: 1 in 1,000 to 1 in 100; rare: 1 in 10,000 to 1 in 1,000; very rare: fewer than 1 in 10,000). Many raw rates come from trials without a placebo group, so some of these events would have happened anyway.
Raw rate seen after vaccination; includes events that would have happened anyway
Product-info band official frequency band; not a precise rate
Claimed link what reviews found
Reaction
Chance
About
Type of figure
Source
Redness at the injection site (1-20 mm), acellular jab Any dose. Old whole-cell jab: 56.3%.
Tetanus (lockjaw): About 11% of recent US cases fatal; highest in people 60+ and the unvaccinated. source
Whooping cough (pertussis): US 2000-2017: 307 deaths; pneumonia in 13.2% of all cases and 18.6% of infants <6 months. No single CFR given. source
Whooping cough (pertussis): US 2024: infants <6 months had the highest hospitalisation rate (33.4%). source
Confirmed serious reactions
Seizures or brain problems after DTaP: studies found no increased risksource
Anaphylaxis (any vaccine): about 1 in 763,000 doses (0.00013%) source
Old whole-cell DTP (no longer used): acute encephalopathy: 0 to 10.5 per million immunisations (IOM 1991: evidence 'consistent with' a causal relation) (0% to 0.00105%) source
Confirmed deaths caused by the vaccine
No official per-dose death rate. SIDS: see the SIDS section below.
Reported deaths within about 72 hours (unverified)
DTaP-containing: 706 of 1,394 VAERS death reports (age 0-2) had onset within about 72 hours
Whole-cell DTP (old): 389 of 867 VAERS death reports (age 0-2) had onset within about 72 hours
Recognised: none with an official rate. IOM 1991/1994: evidence insufficient on permanent brain damage after whole-cell DTP. source
Disputed claims and what reviews found
Type 1 diabetes: IOM 2011: evidence 'favors rejection' (DTaP). source
Asthma, allergies, autoimmune disease (whole schedule): IOM 2013 found no evidence the schedule is unsafe, but noted few studies of these outcomes; not established either way. source
Polio (IPV; oral OPV in the past) UK and US (injected IPV)
The disease: Polio (paralytic)
Chance of catching it (per year)
0
no cases
Chance of dying if you catch it
2–5%
about 1 in 50 to 1 in 20
The vaccine
Severe allergic reaction
0.00013%
about 1 in 763,000
Different bases: disease figures are per person per year across everyone; vaccine figures are per dose or per vaccinated child. Details and sources below.
Full figures and sources
The numbers above in full with years, bases and sources; guide's own conversion into % and "1 in X"
Polio (paralytic)Catching it(chance per person in one recent year, whole population vaccinated or not, unless stated): UK: 0 casessource; US 2025: 0 casessource|Dying from it(same basis unless stated): UK: 0 (no cases)source; US 2025: 0 (no cases)source|Dying if caught: children with paralytic polio: 2% to 5%(about 1 in 50 to 1 in 20)source
vs the vaccine IPV (used now): anaphylaxis (severe allergic reaction), per dose, all vaccines: 0.00013%(about 1 in 763,000)source; Old oral vaccine (OPV, no longer used): paralysis, per dose: 0.000042%(about 1 in 2.4 million)source; OPV, per first dose: 0.00013%(about 1 in 750,000)source
Not the same units: disease figures are the chance per person in one year across the whole population (vaccinated or not); the chance for an unvaccinated child is higher and is not published. Vaccine figures are per dose or per vaccinated child.
All known reactions
Common and rare reactions listed in official product information, WHO reaction-rate sheets, CDC pages and key studies. Chances are per dose unless stated. Percentages and "about 1 in X" are the guide's own conversion. Product-information bands are ranges (very common: 1 in 10 or more; common: 1 in 100 to 1 in 10; uncommon: 1 in 1,000 to 1 in 100; rare: 1 in 10,000 to 1 in 1,000; very rare: fewer than 1 in 10,000). Many raw rates come from trials without a placebo group, so some of these events would have happened anyway.
Raw rate seen after vaccination; includes events that would have happened anyway
Old oral vaccine (OPV, not used in UK/US): paralysis, per dose WHO sheet: 1 in 6.4 million doses in the child given the vaccine, 1 in 2.9 million including contacts.
Polio: pre-vaccine vs 2025 US 20th-century annual average 16,316 paralytic cases (21,000+ in 1952) vs 0 in 2025. source
Chance of catching it: recent year (crude, whole population)
Polio
UK: no paralytic cases: 0 cases; 0 per 100,000 people (none)
US 2025: no paralytic cases: 0 cases; 0 per 100,000 people (none)
Chance of death if caught
Polio: Paralytic polio: 2-5% of children and 15-30% of adolescents/adults die. source
Confirmed serious reactions
IPV: anaphylaxis (any vaccine): about 1 in 763,000 doses (0.00013%) source
Old oral polio vaccine (OPV): vaccine-associated paralytic polio: 1 in 2.4 million doses; 1 in 750,000 first doses (US 1980-94) (0.00004%; 0.00013% for first doses) source
Confirmed deaths caused by the vaccine
No official per-dose death rate for IPV. IPV contains no live virus and cannot cause paralytic polio. The US moved to IPV only in 2000. source
Reported deaths within about 72 hours (unverified)
IPV-containing: 259 of 553 VAERS death reports (age 0-2) had onset within about 72 hours
Oral polio (old): 352 of 791 VAERS death reports (age 0-2) had onset within about 72 hours
Different bases: disease figures are per person per year across everyone; vaccine figures are per dose or per vaccinated child. Details and sources below.
Full figures and sources
The numbers above in full with years, bases and sources; guide's own conversion into % and "1 in X"
HibCatching it(chance per person in one recent year, whole population vaccinated or not, unless stated): England 2024, all ages: 0.000025%(about 1 in 3.92 million)source; US 2025: 21 cases in under-5s (rate not calculated: the under-5 population is not in the sources)source; US before the vaccine, per child by age 5: 0.5%(about 1 in 200)source|Dying from it(same basis unless stated): England 2024 (2 adult deaths): 0.0000034%(about 1 in 29.4 million)source; US: not published|Dying if caught: Hib meningitis, pre-vaccine data: 3% to 6%(about 1 in 33 to 1 in 16)source
vs the vaccine Seizures, meningitis, allergic reactions, fever in under-1s: no increased risk foundsource; Anaphylaxis (severe allergic reaction), per dose, all vaccines: 0.00013%(about 1 in 763,000)source
Not the same units: disease figures are the chance per person in one year across the whole population (vaccinated or not); the chance for an unvaccinated child is higher and is not published. Vaccine figures are per dose or per vaccinated child.
All known reactions
Common and rare reactions listed in official product information, WHO reaction-rate sheets, CDC pages and key studies. Chances are per dose unless stated. Percentages and "about 1 in X" are the guide's own conversion. Product-information bands are ranges (very common: 1 in 10 or more; common: 1 in 100 to 1 in 10; uncommon: 1 in 1,000 to 1 in 100; rare: 1 in 10,000 to 1 in 1,000; very rare: fewer than 1 in 10,000). Many raw rates come from trials without a placebo group, so some of these events would have happened anyway.
Raw rate seen after vaccination; includes events that would have happened anyway
Hib (Haemophilus influenzae type b): pre-vaccine vs 2025 US: ~1 in 200 children under 5 developed invasive Hib; ~20,000 cases/yr vs 21 in 2025. sourcesource 2
Chance of catching it: recent year (crude, whole population)
Hib (Haemophilus influenzae type b)
England 2024, invasive, all ages: 15 cases; 0.03 per 100,000 people (1 in 3,922,300)
US 2025, children under 5 only rate not calculated
Chance of death if caught
Hib (Haemophilus influenzae type b): Hib meningitis: 3-6% die even with treatment (pre-vaccine era data). source
Confirmed serious reactions
Seizures, meningitis/encephalitis, allergic reactions, fever (under 1s): Vaccine Safety Datalink study found no increased risksource
Anaphylaxis (any vaccine): about 1 in 763,000 doses (0.00013%) source
Confirmed deaths caused by the vaccine
No official per-dose death rate.
Reported deaths within about 72 hours (unverified)
This vaccine: 731 of 1,580 VAERS death reports (age 0-2) had onset within about 72 hours
Different bases: disease figures are per person per year across everyone; vaccine figures are per dose or per vaccinated child. Details and sources below.
Full figures and sources
The numbers above in full with years, bases and sources; guide's own conversion into % and "1 in X"
Hepatitis B (acute)Catching it(chance per person in one recent year, whole population vaccinated or not, unless stated): England 2022: 0.00041%(about 1 in 246,000)source; US 2023: 0.00065%(about 1 in 154,000)source|Dying from it(same basis unless stated): UK and US: not published|Dying if caught: not published; the main harm is lifelong infection: up to 90% of babies infected at birth stay infectedsource
vs the vaccine Anaphylaxis (severe allergic reaction), per dose, all vaccines: 0.00013%(about 1 in 763,000)source
Not the same units: disease figures are the chance per person in one year across the whole population (vaccinated or not); the chance for an unvaccinated child is higher and is not published. Vaccine figures are per dose or per vaccinated child.
All known reactions
Common and rare reactions listed in official product information, WHO reaction-rate sheets, CDC pages and key studies. Chances are per dose unless stated. Percentages and "about 1 in X" are the guide's own conversion. Product-information bands are ranges (very common: 1 in 10 or more; common: 1 in 100 to 1 in 10; uncommon: 1 in 1,000 to 1 in 100; rare: 1 in 10,000 to 1 in 1,000; very rare: fewer than 1 in 10,000). Many raw rates come from trials without a placebo group, so some of these events would have happened anyway.
Raw rate seen after vaccination; includes events that would have happened anyway
Aluminium adjuvant effects: See Ingredients of concern: aluminium. A 2017 mouse study on aluminium and brain genes was retracted (see Retracted papers). source
Pneumococcal (PCV) UK and US
The disease: Invasive pneumococcal disease
Chance of catching it (per year)
0.0078%
UK about 1 in 12,800
0.0051%
US about 1 in 19,500
US: 0.0051% (about 1 in 19,500)
Chance of dying if you catch it
12%
about 1 in 8
The vaccine
Severe allergic reaction
0.00013%
about 1 in 763,000
Different bases: disease figures are per person per year across everyone; vaccine figures are per dose or per vaccinated child. Details and sources below.
Full figures and sources
The numbers above in full with years, bases and sources; guide's own conversion into % and "1 in X"
Invasive pneumococcal diseaseCatching it(chance per person in one recent year, whole population vaccinated or not, unless stated): England 2022-23: 0.0078%(about 1 in 12,800)source; US 2021, estimate: 0.0051%(about 1 in 19,500)source|Dying from it(same basis unless stated): UK and US: not published for a recent year|Dying if caught: bloodstream infection: 12%(about 1 in 8)source
vs the vaccine Anaphylaxis (severe allergic reaction), per dose, all vaccines: 0.00013%(about 1 in 763,000)source
Not the same units: disease figures are the chance per person in one year across the whole population (vaccinated or not); the chance for an unvaccinated child is higher and is not published. Vaccine figures are per dose or per vaccinated child.
All known reactions
Common and rare reactions listed in official product information, WHO reaction-rate sheets, CDC pages and key studies. Chances are per dose unless stated. Percentages and "about 1 in X" are the guide's own conversion. Product-information bands are ranges (very common: 1 in 10 or more; common: 1 in 100 to 1 in 10; uncommon: 1 in 1,000 to 1 in 100; rare: 1 in 10,000 to 1 in 1,000; very rare: fewer than 1 in 10,000). Many raw rates come from trials without a placebo group, so some of these events would have happened anyway.
Raw rate seen after vaccination; includes events that would have happened anyway
Product-info band official frequency band; not a precise rate
Reaction
Chance
About
Type of figure
Source
Irritability Babies, 3-dose course, given with other routine jabs (no placebo group).
Different bases: disease figures are per person per year across everyone; vaccine figures are per dose or per vaccinated child. Details and sources below.
Full figures and sources
The numbers above in full with years, bases and sources; guide's own conversion into % and "1 in X"
RotavirusCatching it(chance per person in one recent year, whole population vaccinated or not, unless stated): England 2023-24, positive lab tests: 0.0054%(about 1 in 18,400)source; US: not published (only about 18,400 hospital stays in under-3s, 2022 estimate)source|Dying from it(same basis unless stated): UK and US: not published (US: 20-60 child deaths a year before the vaccine)source|Dying if caught: not published
vs the vaccine Bowel blockage (intussusception) within a week, per vaccinated infant: 0.001% to 0.005%(about 1 in 100,000 to 1 in 20,000)source
Not the same units: disease figures are the chance per person in one year across the whole population (vaccinated or not); the chance for an unvaccinated child is higher and is not published. Vaccine figures are per dose or per vaccinated child.
All known reactions
Common and rare reactions listed in official product information, WHO reaction-rate sheets, CDC pages and key studies. Chances are per dose unless stated. Percentages and "about 1 in X" are the guide's own conversion. Product-information bands are ranges (very common: 1 in 10 or more; common: 1 in 100 to 1 in 10; uncommon: 1 in 1,000 to 1 in 100; rare: 1 in 10,000 to 1 in 1,000; very rare: fewer than 1 in 10,000). Many raw rates come from trials without a placebo group, so some of these events would have happened anyway.
Raw rate seen after vaccination; includes events that would have happened anyway
Extra over background extra cases compared with unvaccinated people or other periods
Product-info band official frequency band; not a precise rate
Reaction
Chance
About
Type of figure
Source
Diarrhoea Placebo trials: not significantly more than placebo.
Extra cases of bowel blockage (intussusception) Up to 6 extra per 100,000 babies, mostly within 7 days of dose 1. Background: 25-101 per 100,000 babies a year.
Different bases: disease figures are per person per year across everyone; vaccine figures are per dose or per vaccinated child. Details and sources below.
Full figures and sources
The numbers above in full with years, bases and sources; guide's own conversion into % and "1 in X"
Meningococcal disease (all groups)Catching it(chance per person in one recent year, whole population vaccinated or not, unless stated): England 2023-24: 0.00058%(about 1 in 173,000)source; US 2023: 0.00013%(about 1 in 778,000)source|Dying from it(same basis unless stated): England 2023-24: 0.000014%(about 1 in 7.35 million)source; US: not published as a count|Dying if caught: England 2023-24, provisional: 2.3%(about 1 in 43)source; US 2023: 10.5%(about 1 in 9)source
vs the vaccine MenB-specific serious reaction: not published; Anaphylaxis (severe allergic reaction), per dose, all vaccines: 0.00013%(about 1 in 763,000)source
England: 88% of cases were group B.
Not the same units: disease figures are the chance per person in one year across the whole population (vaccinated or not); the chance for an unvaccinated child is higher and is not published. Vaccine figures are per dose or per vaccinated child.
All known reactions
Common and rare reactions listed in official product information, WHO reaction-rate sheets, CDC pages and key studies. Chances are per dose unless stated. Percentages and "about 1 in X" are the guide's own conversion. Product-information bands are ranges (very common: 1 in 10 or more; common: 1 in 100 to 1 in 10; uncommon: 1 in 1,000 to 1 in 100; rare: 1 in 10,000 to 1 in 1,000; very rare: fewer than 1 in 10,000). Many raw rates come from trials without a placebo group, so some of these events would have happened anyway.
Raw rate seen after vaccination; includes events that would have happened anyway
Product-info band official frequency band; not a precise rate
Reaction
Chance
About
Type of figure
Source
Fever 38°C or more in babies (with routine jabs) 44-59% with the routine jabs alone (trial comparison).
Chance of catching it: recent year (crude, whole population)
Meningococcal group B (MenB)
England 2023-24, invasive meningococcal, all groups: 341 cases; 0.58 per 100,000 people (1 in 172,500)
US 2023, all groups: 437 cases; 0.13 per 100,000 people (1 in 778,300)
Chance of death if caught
Meningococcal group B (MenB): Overall CFR 10-15% even with antibiotics; up to 20% of survivors have lasting damage (hearing loss, brain damage, limb loss). source
Confirmed serious reactions
Anaphylaxis (any vaccine): about 1 in 763,000 doses (0.00013%) source
Confirmed deaths caused by the vaccine
No official per-dose death rate.
Reported deaths within about 72 hours (unverified)
No VAERS death reports in this group for ages 0-2, or not counted.
GAP: no MenB-specific serious-reaction rate found in CDC/UKHSA sources checked. VAERS has no MenB death reports for ages 0-2 in this query.
MenACWY UK (teenagers) and US (age 11-12, 16)
The disease: Meningococcal disease (all groups)
Chance of catching it (per year)
0.00058%
UK about 1 in 173,000
0.00013%
US about 1 in 778,000
US: 0.00013% (about 1 in 778,000)
Chance of dying if you catch it
2.3%
UK about 1 in 43
10.5%
US about 1 in 9
US: 10.5% (about 1 in 9)
The vaccine
Severe allergic reaction
0.00013%
about 1 in 763,000
Different bases: disease figures are per person per year across everyone; vaccine figures are per dose or per vaccinated child. Details and sources below.
Full figures and sources
The numbers above in full with years, bases and sources; guide's own conversion into % and "1 in X"
Meningococcal disease (all groups)Catching it(chance per person in one recent year, whole population vaccinated or not, unless stated): England 2023-24: 0.00058%(about 1 in 173,000)source; US 2023: 0.00013%(about 1 in 778,000)source|Dying from it(same basis unless stated): England 2023-24: 0.000014%(about 1 in 7.35 million)source; US: not published as a count|Dying if caught: England 2023-24, provisional: 2.3%(about 1 in 43)source; US 2023: 10.5%(about 1 in 9)source
vs the vaccine Anaphylaxis (severe allergic reaction), per dose, all vaccines: 0.00013%(about 1 in 763,000)source
Not the same units: disease figures are the chance per person in one year across the whole population (vaccinated or not); the chance for an unvaccinated child is higher and is not published. Vaccine figures are per dose or per vaccinated child.
All known reactions
Common and rare reactions listed in official product information, WHO reaction-rate sheets, CDC pages and key studies. Chances are per dose unless stated. Percentages and "about 1 in X" are the guide's own conversion. Product-information bands are ranges (very common: 1 in 10 or more; common: 1 in 100 to 1 in 10; uncommon: 1 in 1,000 to 1 in 100; rare: 1 in 10,000 to 1 in 1,000; very rare: fewer than 1 in 10,000). Many raw rates come from trials without a placebo group, so some of these events would have happened anyway.
Raw rate seen after vaccination; includes events that would have happened anyway
Product-info band official frequency band; not a precise rate
Shoulder injury from a jab given too high (bursitis, tendon, nerve or bone injury) National Academies 2024: causal when the needle goes into or next to the bursa, tendon, bone or nerve. They did not estimate a rate.
Different bases: disease figures are per person per year across everyone; vaccine figures are per dose or per vaccinated child. Details and sources below.
Full figures and sources
The numbers above in full with years, bases and sources; guide's own conversion into % and "1 in X"
HPV-linked cancerCatching it(chance per person in one recent year, whole population vaccinated or not, unless stated): UK: 3,299 cervical cancers a year (rate not calculated: UK population not in the sources)source; US, recent annual estimate: 0.015%(about 1 in 6,810)source|Dying from it(same basis unless stated): UK: 880 cervical cancer deaths a year (rate not calculated)source; US: not published|Dying if caught: not applicable: infection usually clears; the harm is cancer years latersource
vs the vaccine Anaphylaxis (severe allergic reaction), per dose, all vaccines: 0.00013%(about 1 in 763,000)source
Not the same units: cancer figures are per person per year across the whole population, mostly adults, years after infection; the vaccine figure is per dose.
All known reactions
Common and rare reactions listed in official product information, WHO reaction-rate sheets, CDC pages and key studies. Chances are per dose unless stated. Percentages and "about 1 in X" are the guide's own conversion. Product-information bands are ranges (very common: 1 in 10 or more; common: 1 in 100 to 1 in 10; uncommon: 1 in 1,000 to 1 in 100; rare: 1 in 10,000 to 1 in 1,000; very rare: fewer than 1 in 10,000). Many raw rates come from trials without a placebo group, so some of these events would have happened anyway.
Raw rate seen after vaccination; includes events that would have happened anyway
Product-info band official frequency band; not a precise rate
No rate cause accepted but no rate published
Reaction
Chance
About
Type of figure
Source
Any injection-site reaction within 5 days Mostly pain, swelling, redness.
Shoulder injury from a jab given too high (bursitis, tendon, nerve or bone injury) National Academies 2024: causal when the needle goes into or next to the bursa, tendon, bone or nerve. They did not estimate a rate.
Lower fertility: Claimed by DeLong 2018; the paper was retracted in 2019 (see Retracted papers). source
Autoimmune conditions: IOM 2011 found the evidence inadequate to accept or reject most autoimmune outcomes. source
Flu (children) UK (nasal, age 2-16) and US (from 6 months)
The disease: Flu
Chance of catching it (per year)
–
not published
Chance of dying if you catch it
–
not published
The vaccine
Nerve damage (Guillain-Barré) after the flu jab
<0.0002%
fewer than 1 to 2 in 1 million
Different bases: disease figures are per person per year across everyone; vaccine figures are per dose or per vaccinated child. Details and sources below.
Full figures and sources
The numbers above in full with years, bases and sources; guide's own conversion into % and "1 in X"
FluCatching it(chance per person in one recent year, whole population vaccinated or not, unless stated): UK and US: not published (no case counts)|Dying from it(same basis unless stated): England 2024-25: about 53 child deaths (rate per child not calculated: child population not in the sources)source; US 2024-25: 280 child deaths (rate not calculated)source|Dying if caught: no single rate publishedsource
vs the vaccine Guillain-Barre syndrome (injected flu vaccine), per person vaccinated: under 0.0001% to 0.0002% (fewer than 1 to 2 in 1 million)source; Narcolepsy after Pandemrix (2009-10, no longer used), per dose: 0.0017% to 0.0019%(about 1 in 57,500 to 1 in 52,000)source
Child flu deaths are counts only, so no like-for-like comparison is possible; the vaccine figures are per person vaccinated or per dose.
All known reactions
Common and rare reactions listed in official product information, WHO reaction-rate sheets, CDC pages and key studies. Chances are per dose unless stated. Percentages and "about 1 in X" are the guide's own conversion. Product-information bands are ranges (very common: 1 in 10 or more; common: 1 in 100 to 1 in 10; uncommon: 1 in 1,000 to 1 in 100; rare: 1 in 10,000 to 1 in 1,000; very rare: fewer than 1 in 10,000). Many raw rates come from trials without a placebo group, so some of these events would have happened anyway.
Raw rate seen after vaccination; includes events that would have happened anyway
Extra over background extra cases compared with unvaccinated people or other periods
Product-info band official frequency band; not a precise rate
No rate cause accepted but no rate published
Reaction
Chance
About
Type of figure
Source
Runny or blocked nose (nasal spray) UK children's flu vaccine is the nasal spray.
Wheezing in babies 6-23 months (not licensed under 2) 3.8% with the injected vaccine. In children with asthma, wheezing was lower with the spray (19.5% vs 23.8%).
Guillain-Barré syndrome (injected flu jab) CDC: some studies estimate the risk at fewer than 1 or 2 cases per million people vaccinated; other studies found no link. CDC: not associated with the nasal spray (product information lists it as frequency not known).
Chance of catching it: recent year (crude, whole population)
No single case count: see the disease section for this guide's figures.
Chance of death if caught
Flu (influenza): Varies widely by season and age; most deaths in people 65+. source
Confirmed serious reactions
Guillain-Barre syndrome (injected flu vaccine): fewer than 1-2 per million people vaccinated (some studies found no link) (under 0.0001%-0.0002%) source
Narcolepsy after Pandemrix (2009-10 pandemic vaccine, no longer used): 1 in 52,000 to 1 in 57,500 doses (England, children) (0.0017% to 0.0019%) source
Confirmed deaths caused by the vaccine
No official per-dose death rate.
Reported deaths within about 72 hours (unverified)
This vaccine: 76 of 138 VAERS death reports (age 0-2) had onset within about 72 hours
Recognised: narcolepsy after Pandemrix (above; BMJ 2013 says the risk may be overestimated). source
Disputed claims and what reviews found
Asthma attacks (inactivated vaccine): IOM 2011: evidence 'favors rejection'. source
COVID-19 US (from 6 months); UK at-risk only
The disease: COVID-19
Chance of catching it (per year)
–
not published
Chance of dying if you catch it
0.005%
about 1 in 20,000
The vaccine
Heart inflammation (teenage boys, 2nd dose)
0.0071–0.011%
about 1 in 14,100 to 1 in 9,440
Nerve damage (Guillain-Barré), Pfizer and Moderna
No rise found
in large studies
Different bases: disease figures are per person per year across everyone; vaccine figures are per dose or per vaccinated child. Details and sources below.
Full figures and sources
The numbers above in full with years, bases and sources; guide's own conversion into % and "1 in X"
COVID-19Catching it(chance per person in one recent year, whole population vaccinated or not, unless stated): UK and US: not published as a rate for children|Dying from it(same basis unless stated): England, Mar 2020-Feb 2021, per child under 18: 0.00021%(about 1 in 480,000)source; US Jul 2024-Jun 2025: 187 child deaths (rate not calculated)source|Dying if caught: England under-18s, 2020-21, per infected child: 0.005%(about 1 in 20,000)source
vs the vaccine Myocarditis, males 16-17, dose 2 (Pfizer), per dose: 0.011%(about 1 in 9,440)source; Myocarditis, males 12-15, dose 2 (Pfizer), per dose: 0.0071%(about 1 in 14,100)source; Guillain-Barre syndrome, Pfizer and Moderna: no increased risk found in large studiessource; Guillain-Barre syndrome, AstraZeneca (not used now), per first dose: 0.00038%(about 1 in 263,000)source; Guillain-Barre syndrome, Johnson & Johnson (not used now), confirmed cases per dose: 0.0019%(about 1 in 53,800)source
Closer match: the England death figure is per child over 11 months (2020-21, earlier variants); the myocarditis figures are per dose in teenage boys, the groups with the highest rates in that study.
All known reactions
Common and rare reactions listed in official product information, WHO reaction-rate sheets, CDC pages and key studies. Chances are per dose unless stated. Percentages and "about 1 in X" are the guide's own conversion. Product-information bands are ranges (very common: 1 in 10 or more; common: 1 in 100 to 1 in 10; uncommon: 1 in 1,000 to 1 in 100; rare: 1 in 10,000 to 1 in 1,000; very rare: fewer than 1 in 10,000). Many raw rates come from trials without a placebo group, so some of these events would have happened anyway.
Raw rate seen after vaccination; includes events that would have happened anyway
Extra over background extra cases compared with unvaccinated people or other periods
Product-info band official frequency band; not a precise rate
Reporting rate reports to a surveillance system per dose
No rate cause accepted but no rate published
Reaction
Chance
About
Type of figure
Source
Babies 6-23 months: irritability More than 60%. Also drowsiness over 40%, loss of appetite over 30%, tenderness over 20%, fever over 10%. Placebo-controlled trial.
Blood clots with low platelets (TTS), AstraZeneca (not used now), after first dose About 15 per million first doses (UK). Product information: very rare.
Blood clots with low platelets (TTS), Johnson & Johnson (not used now) US, 54 cases in 14.1 million doses; 10.6 per million in women 30-39. Deaths: 0.6 per million doses.
Shoulder injury from a jab given too high (bursitis, tendon, nerve or bone injury) National Academies 2024: causal when the needle goes into or next to the bursa, tendon, bone or nerve. They did not estimate a rate.
Chance of catching it: recent year (crude, whole population)
No single case count: see the disease section for this guide's figures.
Chance of death if caught
COVID-19: England under-18s, Mar 2020-Feb 2021 (wild-type and Alpha variants): infection fatality rate about 5 per 100,000 infected (0.005%); 99.995% of those with a positive test survived. source
COVID-19: US: GAP - no case-fatality rate for children found in a primary source.
Confirmed serious reactions
Myocarditis, males 16-17, dose 2 of Pfizer mRNA vaccine (cases meeting the definition, within 7 days; NASEM 2024 found the link causal): 105.9 per million doses = about 1 in 9,400 (0.011%) source
Myocarditis, males 12-15, dose 2 of Pfizer mRNA vaccine: 70.7 per million doses = about 1 in 14,100 (0.0071%) source
Causality (NASEM 2024): mRNA vaccines and myocarditis: evidence 'establishes a causal relationship'source
Guillain-Barre syndrome (GBS), Pfizer and Moderna mRNA (used in the UK and US): no increased risk found: 0.8 confirmed cases per million doses within 21 days, not different from the usual background rate (US Vaccine Safety Datalink, 14.6 million doses)source
GBS, Pfizer first dose (England, 12.1 million people): no association found within 28 days (rate ratio 0.86, 95% CI 0.54-1.36)source
GBS, mRNA: UK guidance: UKHSA: GBS reports after Pfizer and after Moderna 'have not reached the number expected to occur by chance'source
GBS: NASEM 2024 review: Evidence 'favors rejection' of a causal link for Pfizer and for Moderna, and 'favors acceptance' for Johnson & Johnson. One Italian study (Morciano 2023) reported a small rise after Moderna, under 1 extra case per 100,000 doses, with wide uncertainty.source
GBS, AstraZeneca (Vaxzevria), first dose, England, age 16+: 38 extra cases per 10 million people within 28 days (Patone 2021) (0.00038% per first dose, about 1 in 263,000) source
GBS, AstraZeneca: UKHSA estimate: about 5.8 extra cases per million doses in the six weeks after the first dose (Keh 2023, cited in the Green Book) (0.00058% per first dose, about 1 in 172,000) source
GBS, AstraZeneca: regulators: MHRA (21 Oct 2021) and EMA (Sept 2021) list GBS as a 'very rare' side effect (EU category: fewer than 1 in 10,000) (under 0.01%) source
GBS, AstraZeneca: MHRA product information: GBS added as a very rare side effectsource
GBS, Johnson & Johnson (Janssen), confirmed cases: 18.6 per million doses within 21 days (9 cases in 483,053 doses; usual background rate 1-2 per 100,000 people a year) (0.0019% per dose, about 1 in 53,800) source
GBS, Johnson & Johnson: CDC/ACIP July 2021: VAERS reports: 7.8 per million doses; medical-record-confirmed cases in the Vaccine Safety Datalink: 20.2 per million doses within 21 days (0.00078% per dose, about 1 in 128,000; 0.002% per dose, about 1 in 49,500) source
GBS, Johnson & Johnson: FDA July 2021: warning added to the fact sheets after 100 preliminary reports in about 12.5 million doses; FDA said the evidence suggested an association but was not enough to establish cause at that timesource
Which brands are in use now: UK autumn 2026: Moderna (Spikevax) and HIPRA (Bimervax) for adults, Pfizer (Comirnaty) for children; AstraZeneca is not among them, and its EU authorisation was withdrawn at the company's request in March 2024. US: the Johnson & Johnson authorisation was revoked on 1 June 2023 at the company's request.source
Confirmed deaths caused by the vaccine
No official per-dose death rate.
Reported deaths within about 72 hours (unverified)
This vaccine: 5 of 12 VAERS death reports (age 0-2) had onset within about 72 hours
Recognised: myocarditis (above); long-term outcomes not quantified in the sources checked.
Disputed claims and what reviews found
Infertility, heart attack, Guillain-Barre, Bell's palsy (mRNA): NASEM 2024: evidence 'favors rejection' of a causal link. source
Hepatitis A US only (age 1)
The disease: Hepatitis A
Chance of catching it (per year)
0.0014%
UK about 1 in 69,500
0.00048%
US about 1 in 206,000
US: 0.00048% (about 1 in 206,000)
Chance of dying if you catch it
0.3–0.6%
about 1 in 333 to 1 in 167
The vaccine
Severe allergic reaction
0.00013%
about 1 in 763,000
Different bases: disease figures are per person per year across everyone; vaccine figures are per dose or per vaccinated child. Details and sources below.
Full figures and sources
The numbers above in full with years, bases and sources; guide's own conversion into % and "1 in X"
Hepatitis ACatching it(chance per person in one recent year, whole population vaccinated or not, unless stated): England & Wales 2024: 0.0014%(about 1 in 69,500)source; US 2023: 0.00048%(about 1 in 206,000)source|Dying from it(same basis unless stated): England & Wales: not published; US 2023: 0.000025%(about 1 in 4 million)source|Dying if caught: overall: 0.3% to 0.6%(about 1 in 333 to 1 in 167)source
vs the vaccine Anaphylaxis (severe allergic reaction), per dose, all vaccines: 0.00013%(about 1 in 763,000)source
Not the same units: disease figures are the chance per person in one year across the whole population (vaccinated or not); the chance for an unvaccinated child is higher and is not published. Vaccine figures are per dose or per vaccinated child.
All known reactions
Common and rare reactions listed in official product information, WHO reaction-rate sheets, CDC pages and key studies. Chances are per dose unless stated. Percentages and "about 1 in X" are the guide's own conversion. Product-information bands are ranges (very common: 1 in 10 or more; common: 1 in 100 to 1 in 10; uncommon: 1 in 1,000 to 1 in 100; rare: 1 in 10,000 to 1 in 1,000; very rare: fewer than 1 in 10,000). Many raw rates come from trials without a placebo group, so some of these events would have happened anyway.
Raw rate seen after vaccination; includes events that would have happened anyway
Gaps: no official per-dose death rate exists for any routine vaccine in the sources checked; the guide does not create one from VAERS. MenB: no vaccine-specific serious-reaction rate found. Reported 72-hour deaths are counted by vaccine mentioned, so one report naming several vaccines appears in several rows.
SIDS and vaccine timing
SIDS (sudden infant death syndrome) is the sudden death of a baby under 1 that stays unexplained after a full investigation. Babies get several vaccines in the same months that SIDS is most common, so the question is whether deaths after vaccination are more common than they would be by chance. This section shows the trend, the ages, the reported timing, where the "70%" figure comes from, and the research on both sides.
US: sudden unexpected infant deaths per 100,000 births, 1990-2024
1990154.6
1991153.1
1992143.1 AAP: babies on back
1993142.4
1994125.9 Back to Sleep campaign
1995113.1
1996101.4 new death-scene form
199799.2
199894.5
199993.9
200094.4
200194.6
200294.5
200389.7
200492.4
200597.5
200693.0
200797.5
200899.0
200997.1
201090.3
201186.1
201287.6
201387.3
201487.5
201592.6
201691.4
201793.4
201890.9
201990.1
202092.9
202199.2
2022100.9
202398.7
202493.6
SIDS unknown cause accidental suffocation or strangulation in bed. Total shown on the right.
CDC reports these rates source: in 1990, 130.3 SIDS deaths per 100,000 births and 154.6 for all three causes; in 2024, 37.2 and 93.6. CDC reports that "Sharp declines in SUID in the 1990s followed" the 1992 American Academy of Pediatrics safe-sleep advice, the 1994 Back to Sleep campaign and the 1996 death-investigation form, and that "Beginning in 2020, the SUID rate has been increasing" source. Guide's reading of the same CDC figures: from 1990 to 2024 the SIDS rate fell from 130.3 to 37.2 per 100,000 births while unknown-cause deaths rose from 20.9 to 30.3 and suffocation in bed from 3.4 to 26.1. So part of the fall in SIDS is deaths being recorded under other causes; the total of all three is the fairer comparison over time.
England and Wales: unexplained infant deaths, 2004-2024
2004317 (207 SIDS)
2005325 (223 SIDS)
2006285 (184 SIDS)
2007273 (198 SIDS)
2008287 (186 SIDS)
2009283 (187 SIDS)
2010261 (161 SIDS)
2011247 (169 SIDS)
2012234 (163 SIDS)
2013252 (165 SIDS)
2014217 (130 SIDS)
2015195 (119 SIDS)
2016226 (117 SIDS)
2017189 (110 SIDS)
2018213 (114 SIDS)
2019187 (103 SIDS)
2020162 (80 SIDS)
2021189 (117 SIDS)
2022187 (95 SIDS)
2023194 (93 SIDS)
2024p183 (107 SIDS)
sudden infant death (SIDS) unascertained cause. Number of deaths; 2024 provisional. source
Age at death (England and Wales, 2004-2024 combined)
Under 28 days489 (16%)
28 days to under 2 months829 (27%)
2 to under 3 months596 (20%)
3 to under 4 months366 (12%)
4 to under 5 months236 (8%)
5 to under 6 months170 (6%)
6 to under 12 months342 (11%)
ONS reports 3,028 sudden infant deaths in these years by age source. Guide's own arithmetic: 44% happened before 2 months, the age of the first UK vaccines (8 weeks), so they could not have followed a routine vaccine (other than a selective hepatitis B or BCG dose).
VAERS: days from vaccination to death, babies under 1 reported cases only
Days after vaccination
Death reports
Share of reports with a known day
Cumulative share
Day 0 (same day)
276
13.0%
13.0% within 24 hours (day 0)
Day 1
589
27.8%
40.9% by day 1 (about 48 hours)
Day 2
279
13.2%
54.1% by day 2 (about 72 hours)
Day 3
180
8.5%
62.6% by day 3
Days 4-7
328
15.5%
78.1% by day 7
Day 8 or later
463
21.9%
-
Guide's own arithmetic from CDC WONDER: 2,372 death reports for babies under 1 (all years to Sept 2026, all vaccines); 2,115 had a known onset day, 257 did not. Percentages are of the 2,115 with a known day.source
Reported cases only. These are deaths someone chose to report to VAERS because they followed a vaccine. Deaths soon after a vaccine are more likely to be reported (see the VAERS caveat above). They are not a share of all SIDS deaths. "Days after" is the interval from vaccination to the reported event.
Where the "70%" figure comes from
No study found by this guide measured what share of all SIDS deaths happen within 24-72 hours of a vaccine. The figures in circulation come from collections of cases already linked to vaccination:
Torch 1982 (conference abstract): 70% of the SIDS cases studied died within 3 weeks of DTP; 13% within 24 hours and 26% within 3 days source.
Torch 1986: from published case reports of deaths after DTP, about 50% within 24 hours and 75% within 72 hours source.
Miller 2021 (VAERS reports): 58% of infant death reports within 3 days, 78.3% within 7 days; for SIDS reports, 51% and 75.5% source. The journal removed the paper in April 2026 removal notice; the author disputes this author's correspondence.
This guide's VAERS count above: 54% of reports with a known day were within about 72 hours and 78% within a week.
All four count only deaths that were reported or collected after a vaccine. For comparison, a 1985 estimate cited by the IOM put the number of US SIDS deaths expected within 24 hours of DTP by chance, at that time, at about 55 a year source.
How researchers test it: the self-controlled method
Instead of comparing different babies, a self-controlled study compares each baby with itself. For babies who died, it asks: did the death fall in the days just after a vaccine more often than in other days of the same baby's life at a similar age? If vaccines had no effect, deaths would be spread evenly over those days. Because the same baby is compared with itself, family, sleeping position and health are the same on both sides. Its weak point is age: SIDS rises and falls by week of age, so studies must adjust for it. See Definitions.
What the research found
Research reporting a link or timing cluster
Torch 1982 (abstract only, cited by IOM 1991): Of SIDS cases studied, 13% died within 24 hours of DTP, 26% within 3 days, 37% within a week, 70% within 3 weeks. No comparison group. source
Torch 1986 (abstract only, cited by IOM 1991): Summary of 150+ published case reports of deaths after DTP: about 50% within 24 hours, 75% within 72 hours, 90% within a week. The cases were collected because they followed vaccination. source
Baraff 1983, Pediatric Infectious Disease (Los Angeles): Of 53 SIDS victims who had received DTP, 6 died within 24 hours and 17 within a week of it, which the authors call 'significantly more than expected'. They found the same pattern after doctor visits without DTP: 22 of 46 such infants died within a week of the visit. source
Walker 1987, AJPH: SIDS rate 0-3 days after DTP was 7.3 times the rate from day 30 on (95% CI 1.7-31); the same study found unvaccinated infants had 6.5 times the rate of vaccinated infants. The authors said only a small share of SIDS could be associated with DTP. source
Traversa 2011, PLoS One (Italy, self-controlled, about 3 million infants): Within 2 days of a 6-in-1 vaccine: 4 deaths, relative risk 1.5 (95% CI 0.6-4.2, not statistically significant). Within 7 days: relative risk 2.0 (1.2-3.5), limited to the first dose (2.2). The authors say these risks were much lower than earlier German estimates and that leftover effects of age may explain part of the first-dose increase. source
Miller and Goldman 2011, Hum Exp Toxicol: Among highly developed nations, infant mortality correlated with the number of vaccine doses in the schedule (r = 0.70). Country-level (ecological) data, which cannot show cause in individual babies. Critics' reanalysis of 185 countries found a much weaker correlation (r = 0.16); the authors' 2023 reply defends the original finding. source
Miller 2021, Toxicology Reports (removed April 2026): Of VAERS reports of SIDS, 51% within 3 days and 75.5% within 7 days of vaccination. VAERS reports only. The journal removed it for 'serious methodological flaws'; the author disputes this. source
Research not finding a link
Griffin 1988, NEJM (Tennessee Medicaid): Compared with day 31 on, SIDS risk was lower, not higher, 0-3 days after DTP (relative risk 0.18) and 4-7 days after (0.17); no increase overall. source
Hoffman 1987, Pediatrics (NICHD study, 757 SIDS cases): No temporal association between DTP and SIDS was found; babies who died of SIDS were less likely to have had any DTP (39.8%) than matched living babies (55.0% and 53.2%). source
Vennemann 2007, Vaccine (German case-control): No increased SIDS risk in the 14 days after immunisation. source
Vennemann 2007, Vaccine (meta-analysis of 9 studies): Vaccinated infants had about half the SIDS risk (odds ratio 0.54); the authors say a 'healthy vaccinee effect' may explain part of this. source
TOKEN study (Germany, Robert Koch Institute): Self-controlled analysis: risk in the 3 days after the 6-in-1 vaccine was not significantly raised (relative risk 1.54, 95% CI 0.67-3.54); within a week 0.59. The authors say self-selection probably made the risk look higher than it is. source
IOM 1991 and IOM 2003 reviews: 1991: evidence 'does not indicate a causal relation' between DPT and SIDS. 2003: evidence 'favors rejection' of a causal link for whole-cell DTP and for multiple vaccines; inadequate to decide for DTaP alone. source
Moro 2015, Clin Infect Dis (CDC review of VAERS death reports, 1997-2013): Of 1,244 child death reports with a death certificate or autopsy, 544 (44%) were SIDS. The authors: 'No concerning pattern was noted', and the causes of death 'were consistent with the most common causes of death in the US population'. source
GAP: CDC WONDER's death-certificate data could not be queried by this guide (access refused), so US SIDS deaths by age in weeks are not shown.
Vaccinated vs unvaccinated studies
Studies that compare the health of vaccinated and unvaccinated children, or of children with more and fewer vaccines, focusing on chronic, allergic and autoimmune conditions. They differ greatly in size, design and publication status, so each row gives both. All are observational: they show associations, which can come from the vaccines or from differences between the families who choose them.
At a glance
Study
Size
Main finding
Status and quality
Henry Ford Health draft (Lamerato, Zervos et al., c.2020), Michigan
18,468 children; 1,957 unvaccinated
Vaccinated: 2.5 times the rate of any chronic condition; asthma 4.3 times, atopic disease 3.0, autoimmune 6.0 (only 2 cases among the unvaccinated). No difference for cancer, food allergy or autism.
Unpublished draft, never peer-reviewed. Henry Ford Health says it was abandoned for flawed data and methods. Entered into the Senate record on 9 Sep 2025. sourcesource
Mawson et al. 2017, homeschooled children, 4 US states
666 children; 261 unvaccinated
Vaccinated: more reported allergies and neurodevelopmental disorders, but less chickenpox and whooping cough.
A Frontiers journal withdrew an earlier version before publication (2016). Reported retracted by J Transl Sci in May 2017, then reposted; no retraction notice now. sourcesource
Hooker & Miller 2020, 3 US practices
Children born 2005-2015 (records)
Vaccinated in year 1: higher unadjusted odds of asthma (4.5), developmental delay (2.2), ear infections (2.1).
Published (SAGE Open Medicine). Corrigendum and publisher's note, 28 Aug 2026; not retracted. sourcesource
Hooker & Miller 2021, survey of families at 3 US practices
Not checked
Vaccinated: higher odds of asthma (17.6), severe allergies (4.3), digestive disorders (13.8), among others.
Published (J Transl Sci, the same publisher as Mawson 2017). Parent-reported, with chart review. source
Lyons-Weiler & Thomas 2020, one Oregon practice
3,324 children; 561 unvaccinated
More office visits for asthma, allergies and other conditions among the vaccinated.
Retracted on 22 Jul 2021 ('conclusions were not supported by strong scientific data'); the authors disagreed. sourcesource
KiGGS (Schmitz 2011), Germany national survey
13,453 children; 0.7% unvaccinated
Atopic disease was not linked to vaccination status (ages 1-5: 12.6% unvaccinated vs 15.0% vaccinated).
Peer-reviewed. Very small unvaccinated group; parent-reported. source
Kemp 1997, Christchurch (New Zealand) birth cohort
1,265 children; 23 unvaccinated
None of the 23 unvaccinated had asthma before age 10, vs 23.1% of vaccinated children.
Peer-reviewed. Only 23 unvaccinated; the authors could not exclude differences in health-service use. source
McKeever 2004, UK GP records birth cohort
Large GP database
The link between vaccination and asthma or eczema appeared only in children with the fewest GP visits.
Peer-reviewed. Authors: explained by under-diagnosis. Critics: this does not rule out an effect. sourcesource
Hviid 2004, Denmark (all births 1990-2000)
681 cases of type 1 diabetes in 4.7 million person-years
No link between any childhood vaccine and type 1 diabetes (e.g. MMR rate ratio 1.14, 95% CI 0.90-1.45).
No rise in any of 50 autoimmune, allergic or neurodevelopmental conditions with more aluminium (autoimmune HR 0.98 per mg).
Peer-reviewed (Annals of Internal Medicine). Compares amounts of vaccine aluminium, not vaccinated vs unvaccinated. source
Daley 2023, US Vaccine Safety Datalink (aluminium dose)
326,991 children
Slightly higher persistent asthma with more vaccine aluminium (HR 1.19-1.26 per mg).
Peer-reviewed. The authors note small effects and possible residual confounding; more study called for. source
Glanz 2013, US Vaccine Safety Datalink (undervaccination)
323,247 children
Undervaccinated children had fewer outpatient visits (IRR 0.89) but more hospital admissions (IRR 1.21).
Peer-reviewed. Shows that care-seeking differs by vaccination status. source
Miller & Goldman 2011, 34 countries
34 countries
Countries giving more infant vaccine doses had higher infant mortality (r = 0.70).
Peer-reviewed. Country-level comparison, so it cannot show effects on individuals; it does not cover chronic illness. source
The Henry Ford Health draft (c.2020)
A retrospective study of 18,468 children born 2000-2016 in a Michigan health plan, by Lois Lamerato, Abigail Chatfield, Amy Tang and Marcus Zervos. It compared children with no vaccines (1,957) against those with one or more (16,511), using medical records and the Michigan immunisation registry. The draft was entered into the record of a US Senate hearing on 9 September 2025. sourcesource
Outcome (vaccinated vs unvaccinated)
Adjusted hazard ratio (95% CI), Table 3
Cases (vaccinated vs unvaccinated)
Any chronic condition (composite)
2.54 (2.16-2.97)
4,732 vs 160 cases
Asthma
4.29 (3.26-5.65)
2,867 vs 52
Atopic disease
3.03 (2.01-4.57)
946 vs 23
Autoimmune disease
5.96 (1.48-24.11)
201 vs 2
Eczema (not in the composite)
1.31 (1.13-1.52)
-
Neurodevelopmental disorder
5.53 (2.91-10.51)
-
Cancer (used as a control outcome)
0.90 (0.51-1.59), no difference
169 vs 13
Food allergy
1.40 (0.97-2.02), no clear difference
577 vs 30
Diabetes
not calculable (0 unvaccinated cases)
42 vs 0
A hazard ratio of 2 means about twice the rate. Ten years in, 43% of vaccinated and 83% of unvaccinated children had no chronic condition recorded. source
Methodological criticisms and the draft's responses
Follow-up time: The median follow-up was 461 days for unvaccinated children and 970 for vaccinated. Henry Ford says 75% of the unvaccinated were observed only up to age 3, before many chronic conditions can be diagnosed. sourcesource
Healthcare use (detection bias): Vaccinated children averaged 7 healthcare encounters a year and unvaccinated children 2 (almost 5 if they had a chronic condition). More visits give more chances to record a diagnosis. The draft re-ran the analysis using only children with at least one encounter (HR 1.87) and with longer enrolment (1, 3 and 5 years: HR 2.84-4.05); the association remained. Other studies show care-seeking differs by vaccination status. sourcesourcesource
Group differences: Henry Ford says the unvaccinated group had more boys, more white children, and less prematurity and breathing problems at birth. The draft lacked data on income, diet and lifestyle. sourcesource
Exposure definition: Any vaccine vs none. The number of vaccines and the timing between vaccine and diagnosis were not analysed. source
Small numbers for some outcomes: The autoimmune result rests on 2 cases among the unvaccinated, hence the wide confidence interval (1.48-24.11). The abstract and Table 3 give slightly different hazard ratios (e.g. autoimmune 4.79 vs 5.96). source
What each side says
Aaron Siri (lawyer for ICAN), Senate testimony: ICAN asked Dr Zervos in 2017 to run the study; the ICAN film preview played at the hearing says he promised to publish whatever the results. Siri says the authors told him they had not submitted it because they feared for their jobs and did not want to make doctors uncomfortable, and he calls this an example of 'the corruption of science'. Responding to the follow-up-time and detection-bias criticisms, he pointed to the draft's sensitivity analyses and its use of cancer as a control outcome. sourcesource
Henry Ford Health statements (Sep 2025): The draft was 'immediately shelved upon the first internal peer review because of serious issues with its data and methodology' and was never submitted. The health system denies suppressing it for its results, says the draft was shared without its knowledge, and sent a cease-and-desist letter to the film's makers. sourcesource
Dr Jake Scott (minority witness), Senate testimony: Called the draft 'fundamentally flawed by design': vaccinated children had twice the follow-up time and more healthcare visits, which he called 'classic detection bias'. sourcesource
Film 'An Inconvenient Study' (ICAN / Del Bigtree): A documentary about the draft, premiered online on 12 Oct 2025 (originally announced for 3 Oct). A 5-minute preview was played at the hearing. source
The Senate hearing, 9 September 2025
US Senate Committee on Homeland Security and Governmental Affairs, Permanent Subcommittee on Investigations (Chairman Ron Johnson, Ranking Member Richard Blumenthal): "How the Corruption of Science has Impacted Public Perception and Policies Regarding Vaccines", Hart Senate Office Building SH-216, 2:00 pm. sourcesource
Witness
Role
Called by
Introduced at
Aaron Siri
Managing partner, Siri & Glimstad LLP; lawyer for ICAN
Key moments (links open the full video at that time)
Timestamps are for the full-length NTD stream on YouTube and were checked against its captions. The official Senate video is on the committee page. sourcesource
0:00:06 Chairman Ron Johnson opens the hearing and introduces the Henry Ford draft.
0:05:41 Ranking Member Richard Blumenthal's opening statement.
0:16:36 Witnesses sworn in; a 5-minute ICAN preview of the film is played (from 0:16:59).
0:22:32 Aaron Siri introduced; his opening statement on the IOM 2013 report and the Henry Ford draft starts at 0:23:00.
0:29:11 Dr Toby Rogers introduced; his opening statement starts at 0:29:37.
0:34:51 Dr Jake Scott introduced; his opening statement starts at about 0:35:10.
0:37:53 Dr Scott: the Henry Ford draft is 'fundamentally flawed by design' (follow-up time and detection bias).
0:41:09 Siri, asked to defend the draft, describes its sensitivity analyses.
1:20:47 Ranking Member Blumenthal asks Siri why the study was not made public sooner; Siri replies that the authors would not submit it.
3:01:59 Hearing reconvenes; Dr Robert Malone is sworn in and gives a statement (from 3:02:21).
Why aren't more of these studies done?
The ethics argument
A randomised trial that withholds proven vaccines from some children would expose them to preventable disease and weaken community protection. The IOM (2013) recommended that HHS 'refrain from initiating randomized controlled trials' comparing fully vaccinated with unvaccinated children. source
The counter-argument
Children whose parents have already chosen not to vaccinate exist, so observational studies of them are ethical. The IOM found that 'no studies have compared the differences in health outcomes… between entirely unimmunized populations of children and fully immunized children', and called analyses of the Vaccine Safety Datalink 'the most feasible approach'. A CDC-linked white paper (2016) set out how to do this. sourcesource
Practical problems
Fewer than 1% of US children receive no vaccines, so large samples are hard to assemble. Unvaccinated families differ in income, lifestyle and healthcare use, which can bias the results either way. The IOM said such comparisons 'cannot be fully accounted for' and religious groups are too small to give firm answers. sourcesource
What has been done
Registry studies compare specific vaccines, doses or aluminium amounts (Denmark, the Vaccine Safety Datalink). A few studies include a small fully unvaccinated group (Kemp, KiGGS). Studies with large unvaccinated groups are either unpublished (Henry Ford), retracted (Lyons-Weiler) or survey-based with selection problems (Mawson, Hooker & Miller). The IOM concluded there was 'no evidence that the schedule is not safe', while saying long-term studies of the whole schedule 'have not been conducted'. sourcesourcesource
Accountability: statements and the record
Public statements from the COVID-19 response, mainly by Dr Anthony Fauci and Dr Deborah Birx, plus other officials and a manufacturer where the same claim was made, set next to what documents, testimony and data later showed. Quotes are verbatim from the source linked beside them. Each row also gives the person's own response or the wider context. The “status” column is a short neutral description, not a verdict.
What was said vs what the record later showed
When / who
What was said
What the record later showed
Their response / context
Status
11 May 2021Fauci (Senate HELP hearing)
“The NIH has not ever and does not now fund gain-of-function research in the Wuhan Institute of Virology.” source
NIH letter, 20 Oct 2021: in an NIH-funded experiment, mice infected with one modified bat coronavirus “became sicker”, and EcoHealth “failed to report this finding right away, as was required”. NIH Deputy Director Tabak, 16 May 2024: “If you are speaking about the generic term, yes, we did, but the generic term is research that goes on in many, many labs around the country.” sourcesource
Fauci, 3 Jun 2024: “according to the regulatory and operative definition of P3CO, the NIH did not fund gain-of-function research at the Wuhan Institute of Virology.” NIH's 2021 letter also said the viruses studied “are not and could not have become SARS-CoV-2”. sourcesource
Disputed: depends on which definition of “gain-of-function” is used
8 Mar 2020Fauci (CBS 60 Minutes)
“There's no reason to be walking around with a mask.” sourcesource
CDC recommended cloth face coverings in public on 3 Apr 2020; Fauci later supported masking. source
Jan 2024 sworn interview: three reasons at the time (expected shortage of masks for health workers, no good evidence outside hospitals, asymptomatic spread not appreciated). “We learned the answers to those three questions, which had me change my position … otherwise referred to some as flip-flopping. But I didn't flip-flop.” source
Changed; he attributes the change to new evidence
Dec 2020Fauci (New York Times interview)
“When polls said only about half of all Americans would take a vaccine, I was saying herd immunity would take 70 to 75%. Then, when newer surveys said 60% or more would take it, I thought, ‘I can nudge this up a bit,’ so I went to 80, 85.” source
Same article: his public estimate had moved from 60-70% to “70, 75%” to “75, 80, 85%” within weeks. source
The article says he moved it partly because of new science and partly because he felt the country was ready to hear it. He also said: “We really don't know what the real number is.” Other epidemiologists quoted agreed the early range was probably too low. source
Acknowledged by him at the time
16 May 2021Fauci (CBS Face the Nation)
“…you become a dead end to the virus. And when there are a lot of dead ends around, the virus is not going to go anywhere.” source
CDC director Walensky, 27 Jul 2021 (Delta): “Some vaccinated people infected with the delta variant after vaccination may be contagious and spread the virus to others.” CDC restored indoor masking advice for vaccinated people in high-spread areas. source
In the same interview he said transmission by vaccinated people was “extremely unlikely, not impossible”. Walensky: “Unlike the alpha variant that we had back in May … this is different now with a delta variant.” sourcesource
Superseded by later data (Delta variant)
Dec 2020 - Sep 2021Officials and Pfizer: “safe and effective”
MHRA chief Dr June Raine, 2 Dec 2020: “the UK is now one step closer to providing a safe and effective vaccine”. Pfizer, 31 Mar 2021: in 12-15-year-olds the vaccine “demonstrated 100% efficacy” (18 cases on placebo, 0 vaccinated). CDC director Walensky, 29 Mar 2021: “Our data from the CDC today suggests that vaccinated people do not carry the virus, don't get sick.” President Biden, 21 Jul 2021: “you're not going to get COVID if you have these vaccinations.” And 9 Sep 2021: “the vaccine is safe, effective, and free.” sourcesourcesourcesourcesource
CDC, 1 Apr 2021: “Dr. Walensky spoke broadly … It's possible that some people who are fully vaccinated could get Covid-19.” FDA added a myocarditis warning on 25 Jun 2021. Use of the J&J vaccine was limited in May 2022, and its US authorisation was revoked at the company's request in Jun 2023. AstraZeneca's EU authorisation was withdrawn at its own request in Mar 2024. UK data: two-dose Pfizer protection against symptomatic Omicron fell from 65.5% at 2-4 weeks to 8.8% after 25 weeks. sourcesourcesourcesourcesourcesource
We found no official who said “100% safe”. In 2024 FDA's Peter Marks testified: “No pharmaceutical is 100% safe.” The subcommittee chairman said the public “hear 100% safe and 100% effective” when officials say “safe and effective”. Pfizer's 100% figure counted symptomatic cases only, with no tests for silent infection. AP said Biden's town-hall claim went too far. CDC data in 2021 still showed far fewer hospitalisations and deaths among the vaccinated. sourcesourcesourcesource
Absolute claims later qualified; protection against severe illness held up better than against infection
2020 guidance; Jan 2024 interviewFauci on the 6-foot rule
Federal guidance from 2020 told people to keep 6 feet apart (in schools, businesses and Congress, as the interviewer noted). source
Fauci, sworn interview Jan 2024: “You know, I don't recall. It sort of just appeared.” Asked about studies: “I was not aware of studies that -- in fact, that would be a very difficult study to do.” It was “an empiric decision that wasn't based on data or even data that could be accomplished.” source
Fauci, 3 Jun 2024: “It actually came from the CDC.” “What I meant by ‘no science behind it’ is that there wasn't a controlled trial that said, compare 6-foot with 3 feet with 10 feet.” He said CDC relied on older studies of how far droplets travel. source
Acknowledged: not based on a specific study
17 Apr 2020Fauci (White House briefing)
On the virus's origin, citing a new paper: “…the mutations that it took to get to the point where it is now is totally consistent with a jump of a species from an animal to a human.” source
Kristian Andersen's email to Fauci, 31 Jan 2020: “some of the features (potentially) look engineered”. After a 1 Feb call, his team's paper (17 Mar 2020) said: “we do not believe that any type of laboratory-based scenario is plausible.” US intelligence agencies remain divided on the origin. sourcesourcesource
Fauci, 3 Jun 2024: the scientists changed their view after further examination; “I had no input into the content of the published paper”; “I have always kept an open mind to the different possibilities.” source
Still contested: the origin is unresolved
3 Jun 2024Fauci on his adviser David Morens
“I knew nothing of Dr. Morens's actions regarding Dr. Daszak, EcoHealth, or his emails.” And: “to the best of my knowledge, I have never conducted official business using my personal email.” source
Morens email, 24 Feb 2021: “i learned from our foia lady here how to make emails disappear after i am foia'd but before the search starts”. On 18 Aug 2026 Morens pleaded guilty to conspiracy to defraud the United States by hiding federal records in his personal Gmail. Court papers refer to an unnamed “Senior NIAID Official 1”. sourcesource
Morens told Congress in May 2024 that some remarks were “snarky jokes” and that he did not knowingly delete official records. Fauci has not been charged in connection with Morens. sourcesource
Adviser pleaded guilty; Fauci not charged
16 Mar 2020 onwardWhite House: “15 Days to Slow the Spread”
The 16 Mar 2020 guidelines were titled “15 Days to Slow the Spread”. In Jan 2024 Fauci told House investigators the aim was this: “It was to flatten the curve, so that it wasn't necessarily geared at decreasing the ultimate number of cases, but the number of cases that we could actually handle.” sourcesource
On 31 Mar 2020 the guidelines were extended as “30 Days to Slow the Spread”, to 30 Apr 2020. CDC's 6-foot distancing advice stayed until 11 Aug 2022. The federal COVID-19 public health emergency ended on 11 May 2023. Most closures and orders were set by states, so how long they lasted varied by state. sourcesourcesource
Fauci, Jan 2024: “no one, I think, really believed that a pause for 15 days with an outbreak that's doing this exponentially is going to be the final solution.” For Dr Birx's own account of planning the extension, see the Birx “15 Days” row below. source
Extended within two weeks; some federal guidance lasted until 2022-23
16 Mar 2020Birx (“15 Days to Slow the Spread”)
The White House issued “15 Days to Slow the Spread” guidelines. Fauci later said Dr Birx “was the main driver of that”. sourcesource
Birx, in her 2022 book: “No sooner had we convinced the Trump administration to implement our version of a two-week shutdown than I was trying to figure out how to extend it. Fifteen Days to Slow the Spread was a start, but I knew it would be just that.” sourcesource
Her book says the aim was slowing the spread while making measures acceptable to the administration. Fauci (Jan 2024): “I think it was an empiric choice on the part of Debbie”, made “knowing deep down that it was going to be more” than 15 days. sourcesource
Acknowledged in her own book (see also the White House “15 Days” row above)
Dec 2020 / Jul 2022Birx on vaccines and infection
16 Dec 2020: “This is one of the most highly effective vaccines we have in our infectious disease arsenal.” source
22 Jul 2022 on Fox News: “I knew these vaccines were not going to protect against infection. And I think we overplayed the vaccines…” source
In the same answer she said vaccines will protect against severe disease and urged vaccination, especially over 70. PolitiFact found she said in Dec 2020: “we don't know how great these vaccines might be against preventing infection.” sourcesource
Disputed: critics call it a reversal; PolitiFact found her consistent
16 Jul - 9 Sep 2021Walensky and Biden: “pandemic of the unvaccinated”
Walensky, 16 Jul 2021: “This is becoming a pandemic of the unvaccinated.” Biden, 21 Jul 2021: “We have a pandemic for those who haven't gotten a vaccination.” Biden, 9 Sep 2021: “This is a pandemic of the unvaccinated.” We found no UK minister using the phrase; Ireland's Leo Varadkar used it in Nov 2021. sourcesourcesourcesourcesourcesource
From 1 May 2021, CDC only investigated breakthrough cases that ended in hospital or death, and said reported breakthroughs were “likely a substantial undercount”. Under Delta, the gap in case rates between unvaccinated and vaccinated narrowed from 11.1 times to 4.6 times. Walensky, 5 Aug 2021: vaccines “continue to work well with delta with regard to severe illness and death … But what they can't do anymore is prevent transmission.” sourcesourcesource
Same CDC data: under Delta, people not fully vaccinated were still 10.4 times as likely to be hospitalised and 11.3 times as likely to die. On 16 Jul Walensky said about 97% of people entering hospital with COVID were unvaccinated. CDC kept running studies that counted all breakthrough infections. sourcesourcesource
Supported for severe illness in mid-2021; not for infection and spread
Dr Fauci at the Senate, 29 July 2026
Senate Committee on Homeland Security and Governmental Affairs (Chairman Rand Paul, Ranking Member Gary Peters), “Testimony of Anthony Fauci”, Dirksen SD-342, 8:30 am. sourcesource
What happened: Under subpoena, Dr Fauci (85) gave a short prepared statement, then answered every question with: “On the advice of counsel, I respectfully decline to answer based upon my rights under the Fifth Amendment to the Constitution.” In the official transcript this answer appears 111 times (the guide's own count). sourcesourcesource
The pardon: On 19 Jan 2025 President Biden gave him “A Full and Unconditional Pardon” for federal offences from 1 Jan 2014 related to his roles. Chairman Paul ruled the Fifth Amendment unavailable for that period (citing Brown v. Walker, 1896), and also ruled that Fauci had waived it with his opening statement. sourcesource
His stated reasons: “…given Senator Paul's obvious obsession with calling for my prosecution, his repeated slanderous comments about me, and recently his publicly releasing my unredacted personal diary … the only conclusion I can reach is that the sole reason he is calling me before this Committee is to get me to say something, anything, that could vindicate his repeated public pledges that I end up in, in his words, ‘behind bars.’” He noted he had testified or briefed Congress “well over 200 times”. source
His lawyer: David Schertler: Fauci “has a valid Fifth Amendment privilege, and he has the right to assert it.” The circumstances “regrettably made his continued cooperation impossible.” NBC reported the pardon was a factor, because Republicans had suggested it would not cover new statements. source
Committee members: Republicans questioned his advice on lockdowns and his account of virus origins. Democrats described the hearing as an effort to entrap him into perjury; Ranking Member Peters said it “does real damage” and would deter experts from public service. sourcesource
What has happened since
6 Aug 2026: The committee voted 8-7 along party lines to hold him in contempt and approved a resolution asking the President of the Senate to certify it to the US Attorney for DC. sourcesourcesource
6 Aug 2026: Paul delivered the referral straight to the Justice Department without a full Senate vote. A DOJ spokesperson said the department was “reviewing it and will work with the Senate accordingly.” sourcesource
Late Aug-Sep 2026: The WSJ reported the push had stalled, with officials questioning whether skipping a full Senate vote is procedurally sound. Legal commentators note that the contempt statute (2 U.S.C. 194) and a 1966 appeals ruling require the full chamber to act while it is in session. sourcesourcesource
As of 22 Oct 2026: The guide found no public report of any charge against Dr Fauci. Separately, his former adviser David Morens pleaded guilty on 18 Aug 2026; sentencing was set for November. sourcesource
Watch (links open at the moment shown; nothing plays on this page)
Timestamps are for C-SPAN's full-length upload on YouTube and were checked against its captions. The official committee video is on the hearing page. Short news clips: CNNCBS. Write-ups: APReutersNBC. sourcesource
0:00:00 Chairman Paul's opening statement (the upload joins it in progress).
0:21:37 Fauci is recognised and reads his prepared statement, ending by invoking the Fifth Amendment.
0:25:40 First question and first invocation; Paul points to 2 U.S.C. 192 in the red folder.
0:40:20 Paul says he has denied the privilege claim “despite the existence of the pardon”; Fauci's lawyer is then removed from the room.
1:15:36 Senator Blumenthal declines to question and compares the hearing to the McCarthy era.
1:41:22 Senator Hawley asks simple questions (day of the week, tie colour); each gets the same answer.
2:53:00 Paul announces a committee vote on contempt the following week.
Earlier clips cited in the table
0:01:22 16 Jul 2021: Walensky, “This is becoming a pandemic of the unvaccinated” (White House).
0:00:51 9 Sep 2021: Biden, “the vaccine is safe, effective, and free” (White House).
0:02:48 9 Sep 2021: Biden, “This is a pandemic of the unvaccinated” (White House).
0:01:50 11 May 2021: Fauci to Senator Paul on Wuhan funding (The Hill).
0:03:26 20 Jul 2021: “Senator Paul, you do not know what you are talking about” (C-SPAN).
0:06:03 20 Jul 2021: “if anybody is lying here, Senator, it is you” (C-SPAN).
0:00:29 8 Mar 2020: “There's no reason to be walking around with a mask” (60 Minutes).
Dr Deborah Birx: statements in her own words
Dr Birx was the White House Coronavirus Response Coordinator in 2020-21. These are her own words from her 2022 book, her sworn House testimony, and a 2022 television interview.
2022, book, on extending “15 Days”: “No sooner had we convinced the Trump administration to implement our version of a two-week shutdown than I was trying to figure out how to extend it. Fifteen Days to Slow the Spread was a start, but I knew it would be just that. I didn't have the numbers in front of me yet to make the case for extending it longer, but I had two weeks to get them.” Fauci later described the 15 days as “an empiric choice on the part of Debbie”.sourcesourcesource
2022, book, on the gathering limit: “I had settled on ten knowing that even that was too many, but I figured that ten would at least be palatable for most Americans…” The word “palatable” in the book refers to the ten-person limit and to making measures acceptable to the administration; the book does not say the 15-day length itself was chosen for that reason.sourcesource
2022, book, on early messaging: “We had to make these palatable to the administration by avoiding the obvious appearance of a full Italian lockdown. At the same time, we needed the measures to be effective at slowing the spread…” Her stated aim: slow spread without the word “lockdown”, which she says would have got her sidelined.sourcesource
2022, book, on her reports to state governors: “Our Saturday and Sunday report-writing routine soon became: write, submit, revise, hide, resubmit.” She describes putting back advice that White House officials had edited out, so that governors still received it.sourcesource
23 Jun 2022, House testimony, asked whether officials were guessing or lying when they said vaccinated people could not transmit: “I think it was hope that the vaccine would work in that way, and that is why I think scientists and public health leaders always have to be at the table, being very clear about what we know and what we do not know.” Also: “we never had the data that it was going to protect against asymptomatic infection.” She explained the original trials measured only symptomatic disease.source
23 Jun 2022, House testimony, on deaths in the first year: She agreed with a member's summary that “more than 130,000 American lives could have been saved” with better mitigation: “Through that first year of the pandemic, correct.” This is her own estimate, drawn from a 2021 interview with the subcommittee.source
22 Jul 2022, Fox News, on vaccines: “I knew these vaccines were not going to protect against infection. And I think we overplayed the vaccines, and it made people then worry that it's not going to protect against severe disease and hospitalization. It will.” In the same answer she urged vaccination and boosters, especially for people over 70. Video is on the Fox page.sourcesource
How this section was built: we included only items with a primary source (an official transcript, letter, court document or the original broadcast) or a direct quotation from one, and quoted them exactly. Where a quote is taken from a book, we link both the book and the review that reproduces the passage. Morens's 2024 testimony is summarised from news reports; the hearing page is here: source.
Retracted and removed papers
Removal alone does not prove a paper right or wrong; here is each case so you can weigh it.
Vaccine-safety papers that a journal or preprint server retracted, withdrew or removed, with the journal's stated reason. Only cases with a notice or a publisher statement this guide could check are listed. Listed by publication date.
12 children with bowel disease and developmental regression; in 8, parents linked the start of symptoms to MMR vaccination.
Journal's stated reason
After the UK General Medical Council ruling: claims that children were 'consecutively referred' and that investigations were ethics-approved were 'proven to be false'.
Author response
Author response: no response document found linked from the notice.
Female mice given aluminium adjuvant or Gardasil showed behavioural abnormalities.
Journal's stated reason
Withdrawn at the editor-in-chief's request; outside experts judged the methods seriously flawed. A revised version was later published in Immunologic Research.
Author response
Authors republished a revised version elsewhere (see notice link).
Aluminium injected at vaccine-adjuvant levels changed immune-gene activity in mouse brains, which the authors compared with autism biomarkers.
Journal's stated reason
Retracted at the request of the editor and the authors: gel images in several figures were 'incorrectly presented' and original gels were unavailable, so results were 'clearly not reliable'.
In one paediatric practice, concluded that unvaccinated children 'are not unhealthier than the vaccinated' and may be healthier overall, based on office visits for many diagnoses.
Journal's stated reason
Investigation found methodological issues; conclusions 'not supported by strong scientific data'.
Author response
The notice records that the authors did not agree with the retraction.
From an online survey of 2,840 people, estimated that US deaths from COVID-19 vaccination 'may be as high as 278,000'.
Journal's stated reason
Methods could not establish that the vaccine caused the deaths; reported deaths were not verified; limitations not described; ethics statement incorrect.
Author response
Skidmore disagreed and published a response. author response
Hulscher, McCullough et al., Forensic Science International
Systematic review of published autopsy reports, concluding that most of the deaths reviewed were caused by, or significantly contributed to by, COVID-19 vaccination.
Journal's stated reason
Withdrawn by the editors-in-chief: inappropriate citation, inappropriate method design, errors and lack of support for the conclusions, and failure to cite disconfirming evidence. An earlier version was removed by Preprints with The Lancet in 2023 'because the study's conclusions are not supported by the study methodology'.
Excess deaths in 47 Western countries 2020-2022; the discussion named possible causes including COVID-19 vaccination.
Journal's stated reason
'Misinformation in the discussion regarding the possible causes of excess mortality', and limits of the work not sufficiently described.
Author response
Two authors agreed with the retraction but not that the article contains misinformation; Mostert disagrees with the decision (stated in the notice).
Removed without a formal retraction notice
Mawson et al., Frontiers in Public Health 2016 / Journal of Translational Science 2017: Survey of homeschooled children reporting more chronic illness in vaccinated children. Frontiers removed the provisionally accepted paper in 2016. The 2017 journal told Retraction Watch it had retracted it, but the paper is back on the publisher's site and no formal retraction notice was found. Retraction Watchpaper
For balance: retractions on the other side
This guide looked for retracted papers that had concluded vaccines are safe or effective. No retraction of a paper with a vaccine-safety conclusion was verified. The nearest case found:
Ramsay et al., BMC Medicine 2017: Influenza vaccine-effectiveness meta-analysis (repeated vaccination); retracted by its own authors on 12 Aug 2018 for 'erroneous inclusions and an omission of estimates' that affected some conclusions. source
GAP: other retractions sometimes cited (for example papers by Classen, and other Shaw/Tomljenovic papers) were not verified against a notice and are not listed.
Definitions: how "vaccine" was defined, then and now
Who / term
Before
After
When
CDC Vaccine
A product that stimulates a person's immune system to produce immunity to a specific disease, protecting the person from that disease. archived copy
A preparation that is used to stimulate the body's immune response against diseases. archived copy
Changed between 1 and 28 September 2021 (Wayback snapshots)
CDC Vaccination
The act of introducing a vaccine into the body to produce immunity to a specific disease. archived copy
The act of introducing a vaccine into the body to produce protection from a specific disease. archived copy
Changed between 1 and 28 September 2021
Merriam-Webster Vaccine
a preparation of killed microorganisms, living attenuated organisms, or living fully virulent organisms that is administered to produce or artificially increase immunity to a particular disease archived copy
a preparation that is administered (as by injection) to stimulate the body's immune response against a specific infectious agent or disease: such as a: an antigenic preparation of a typically inactivated or attenuated ... pathogenic agent ... or one of its components or products ... b: a preparation of genetic material (such as a strand of synthesized messenger RNA) that is used by the cells of the body to produce an antigenic substance (such as a fragment of virus spike protein) archived copy
Changed between 15 and 26 January 2021 (Wayback snapshots)
Disease doses (this guide's counting term): each dose of a vaccine counts once for every disease it covers. A 6-in-1 (DTaP/IPV/Hib/HepB) counts as 6, MMRV as 4, the pre-school 4-in-1 (dTaP/IPV) as 4, MMR, DTaP and the teenage 3-in-1 (Td/IPV) as 3, Hib/MenC as 2, and a single-disease vaccine as 1. All meningococcal groups count as one disease, so MenACWY counts as 1. Injections are the number of shots. Products given counts each combination once. Used in How the schedule has changed.
Terms used in the injury, SIDS and retraction sections
VAERS
Vaccine Adverse Event Reporting System, run by CDC and FDA. Anyone can report a health problem after a vaccine. A report does not show the vaccine caused it.
Serious report
In VAERS, a report of death, a life-threatening illness, a hospital stay or a longer stay, permanent disability, or a birth defect.
VICP / VDPS
The US Vaccine Injury Compensation Program and the UK Vaccine Damage Payment Scheme, which pay people found (or agreed in a settlement, in the US) to have been harmed by a vaccine.
SIDS, SUID and unascertained
SIDS: the sudden death of a baby under 1 that stays unexplained after a full investigation. SUID (US) adds deaths of unknown cause and accidental suffocation in bed. "Unascertained" (England and Wales) means the cause could not be found.
Self-controlled study
A study that compares the same child's risk in the days just after a vaccine with that child's risk at other times, so the child is their own comparison.
Crude incidence
Cases in a year divided by the whole population, with no adjustment for age or vaccination.
Retracted, withdrawn, removed
Retracted: the journal publishes a notice that the paper should no longer be relied on, but the paper stays visible, marked. Withdrawn: usually an accepted paper taken down before final publication. Removed: taken off the site, sometimes with no notice.
With thanks
I didn't do the real work behind a lot of what is on this page. These people did. They went through the courts and did it properly. If you want to know more, please watch them, listen to them and follow them, not me. All I've done is point at the information in a way I understand. Their views and claims are their own; this guide only says who they are and where to find them.
Aaron Siri: managing partner of Siri & Glimstad LLP, a law firm that regularly represents ICAN.
Toby Rogers: has a PhD in political economy from the University of Sydney and writes the uTobian newsletter on Substack.
Thank you too to all the scientists running these trials and studies, and to everyone helping them and taking part in them.
About this data
Every figure links to its source. Most are official government health agencies (UKHSA/NHS, CDC), medicine regulators (EMA, MHRA via emc, FDA) or major peer-reviewed studies.
Counts are reported cases unless marked 'estimated'. UK figures are often England-only.
'Share of cases that were unvaccinated' is not the same as risk; it depends on how many people in the population are vaccinated.
Pre-vaccine figures come from older reporting systems and are not exactly comparable with modern surveillance.
Items marked GAP or UNVERIFIED need checking before publication.
This page gives no advice and takes no position. For decisions about your own family, read the linked documents and speak to a clinician you trust.
Compiled 2026-10-22. Figures change; check the linked source for the latest version.